Visualizing Geohazards and Risk with Code (GeoCode)
Importance
With the advance in technologies embedded in satellites and science observatories, lots of high-quality data are continuously collected and are available to scientists who study geohazards, such as earthquakes, volcanoes, and tsunamis. How do scientists explore how hazards form? How do they think about impacts associated with the hazards? How do they determine the risks associated with the hazards?
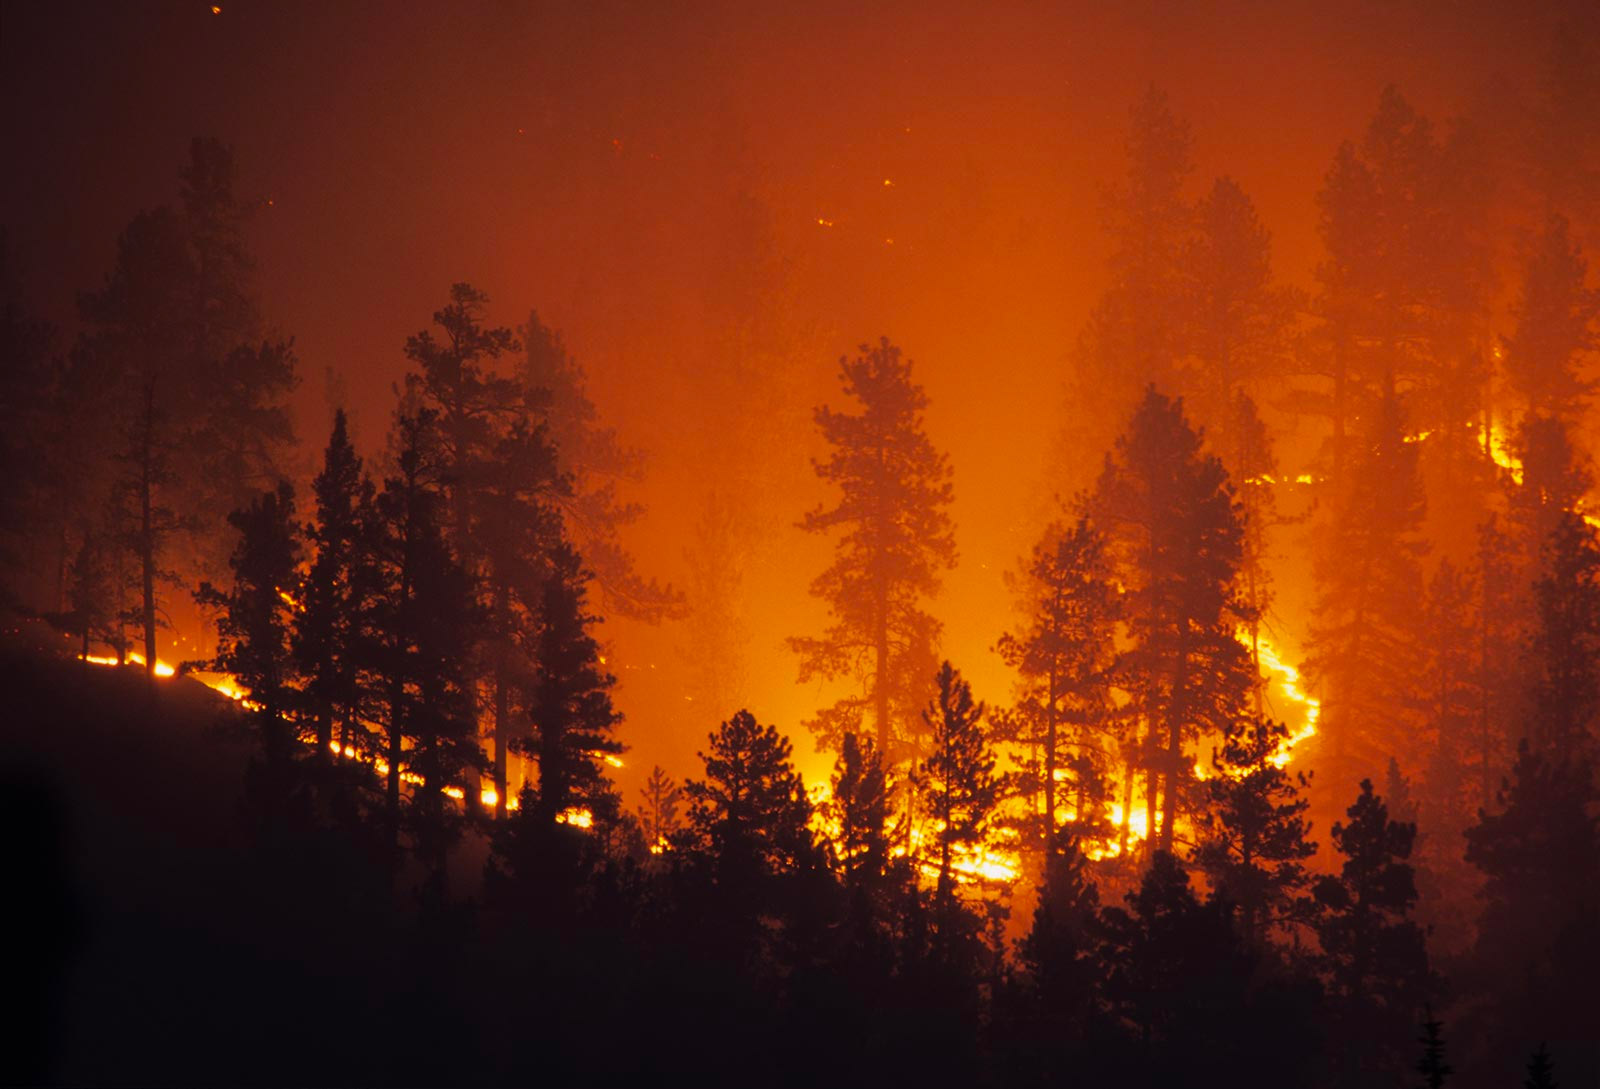
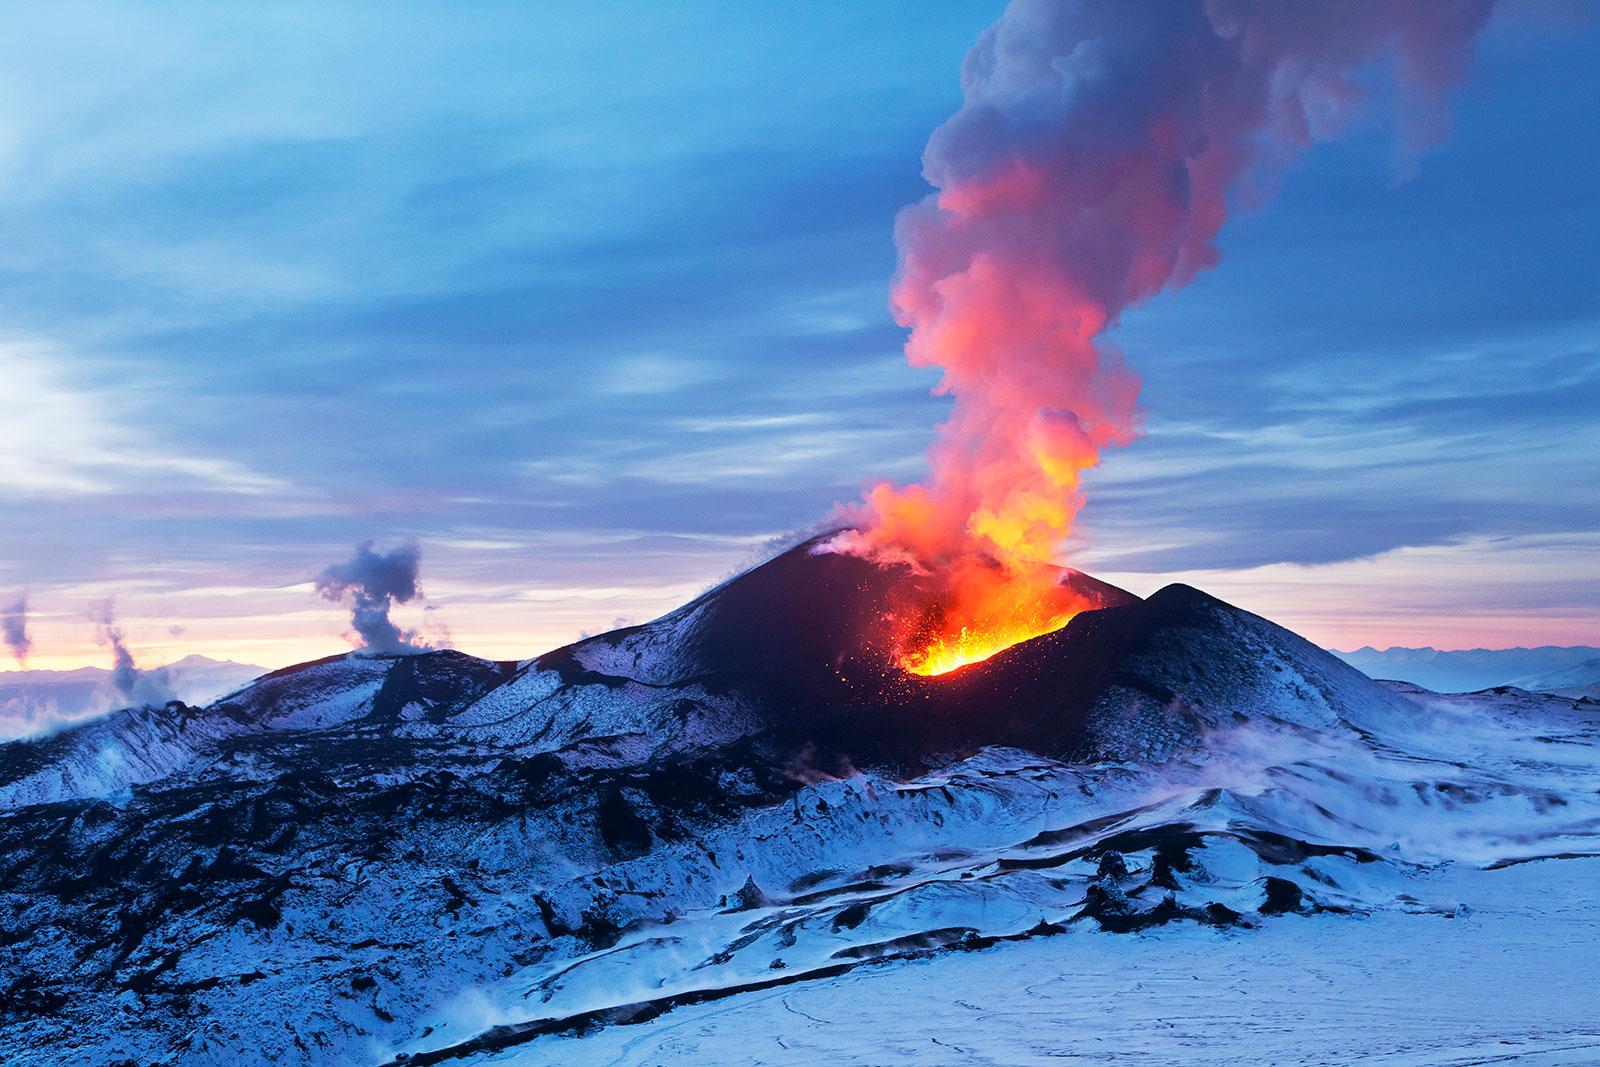
Geohazards are not only scientifically important, they are also captivating to students. Recent images of lava flowing out of the Kilauea volcano in Hawaii are nothing short of remarkable. Geoscientists investigate the mechanisms that cause geohazards and the impacts associated with those hazards. Their work helps citizens make informed decisions and take appropriate actions by considering their local community’s vulnerability and exposure to the impending risk.
Much of geohazard research involves computational analyses and visualizations of large data sets. We make discoveries by finding meaningful patterns in data. Scientists frequently write programs to filter, sort, translate, and display data in novel ways that give rise to new theories and insights about what the data signifies. Arguably the field of geohazard science is rapidly changing to a point where discoveries and innovations are coming from practitioners who can write code that processes and displays data in insightful ways, and who can encode their hypotheses into algorithms.
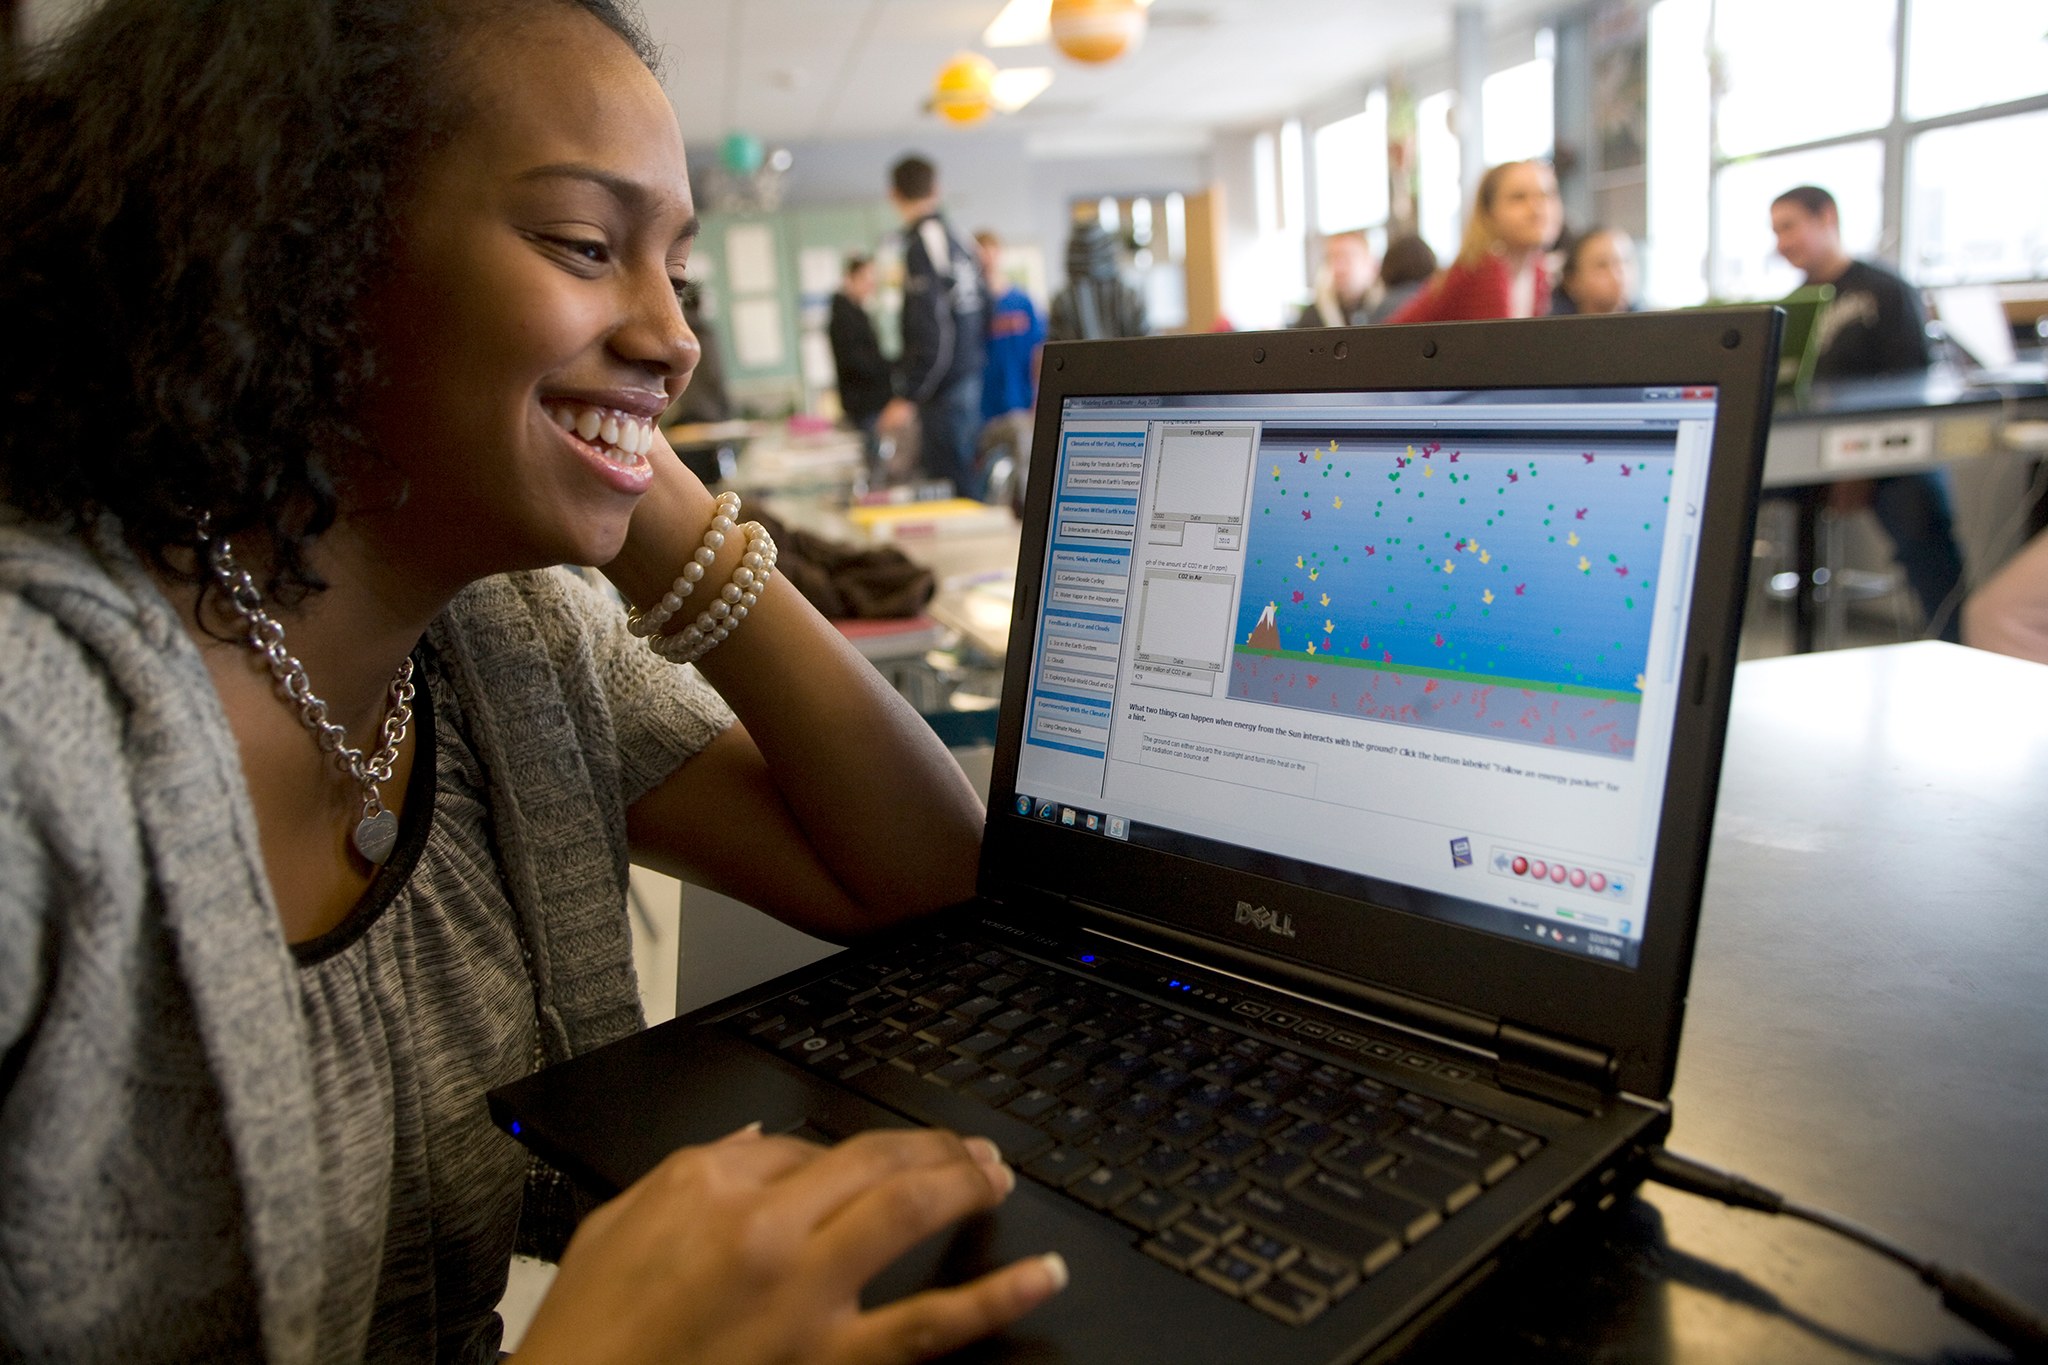
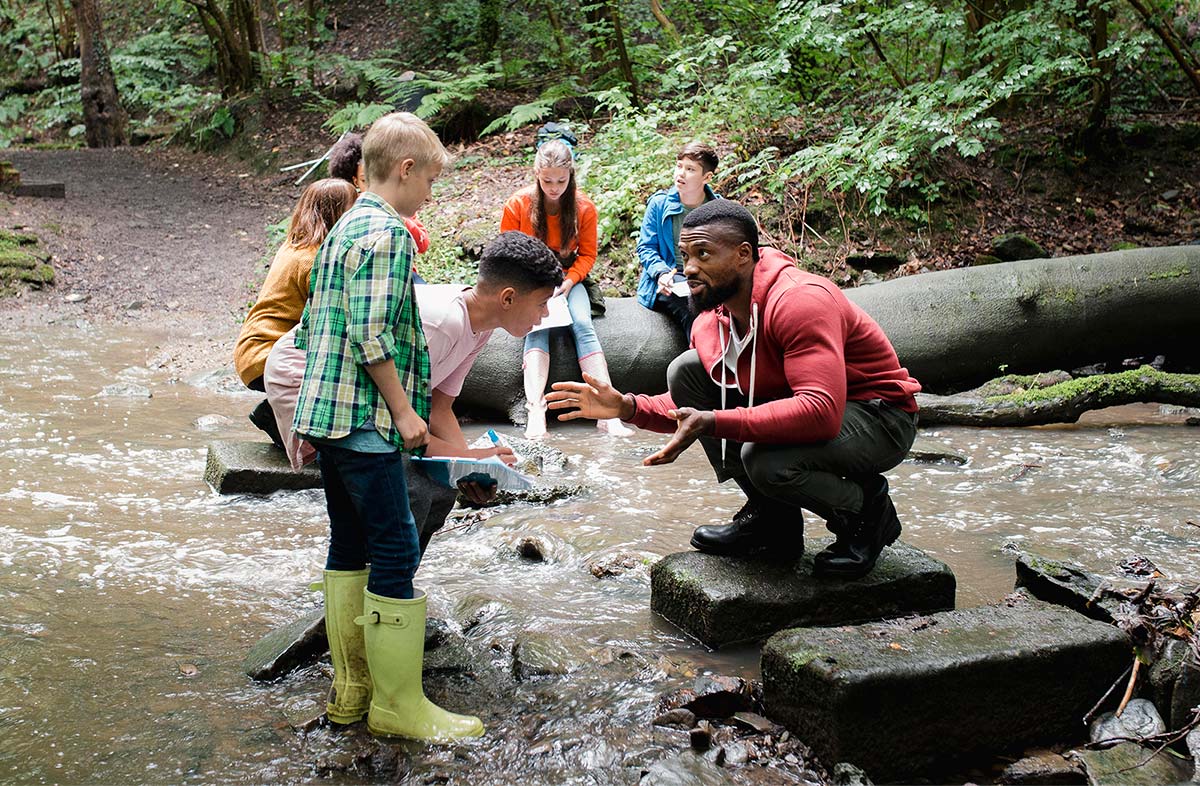
Learning about hazards, therefore, offers an ideal context for students to experience integrated practices between science and computational thinking. The Next Generation Science Standards (NGSS) advocates for the inclusion of natural hazards content in Earth science classes in both middle school and high school. Specifically, NGSS suggests that students should analyze and interpret data on natural hazards, consider technologies to mitigate their effects, and use evidence to build student understanding.
GeoCode will engage students in problem-solving similar to practices of scientists who study real-world volcanic and seismic geohazards. Students will transform high-precision, scientific-grade, real-world GPS data into interpretable visualizations and use them as evidence to formulate scientific arguments about predicting the impact of geohazards. The project will develop a Scaffolded Visualization Programming (SVP) tool that will allow students to program spatially and temporally distributed visualizations. The project will also develop two curriculum modules that feature the SVP tool and computationally integrated inquiry-based activities in which students explore specific hazards and potential impacts of the hazards.
Research
Research on student learning is guided by the following questions:
- How do students translate their understanding of a geohazard into an algorithmic model to create visualizations? How do students interpret data represented in visualizations to improve their understanding?
- How do students use visualizations they create in formulating scientific arguments to assess risks related to a geohazard?
- Does GeoCode’s curricular approach improve students’ understanding of geohazards and data-based scientific argumentation associated with risk assessment?
Publications
- Lore, C., Lee, H.-S., Pallant, A., & Chao, J. (2024). Using multiple, dynamically linked representations to develop representational competency and conceptual understanding of the earthquake cycle. Computers & Education. 222.
- Lore, C., Lee, H.-S., Pallant, A., Connor, C., & Chao, J. (2023). Integrating computational thinking into geoscientific inquiry about volcanic eruption hazards and risks. International Journal of Science and Mathematics Education.
- Lore, C., & Seevers, S. (2022). Using block coding to model gps motion, land deformation, and earthquake risk. The Earth Scientist, 39(1), 11–15.
- Lore, C. (2022). Monday’s lesson: Tephra in the wind. @Concord, 26(1), 7.
- Paessel, N. (2020). Visualizing geohazards and risk with code. @Concord, 23(3), 10-11.
- Lee, H.-S. (2020). Making uncertainty accessible to science students. @Concord, 23(3), 14-15.
- Pallant, A. (2020). Perspective: Transforming earth science education with technology. @Concord, 23(3), 2-3.
Blog Posts
Learn more about the GeoCode project at the Concord Consortium blog.
- Four key research findings from NSF-funded GeoCode project
- Linking block coding, visual representations, and science concepts
- GeoCode: Volcanic Hazards Module Released to the Public