
To ensure that blind and low-vision (BLV) learners can engage meaningfully in data science education, we’re designing an AI-supported natural language plugin for CODAP called DAVAI (Data Analysis through Voice and Artificial Intelligence). Students use voice or typed input to ask questions about datasets in CODAP, then get dynamically generated descriptions and optional sonification—hearing the […]
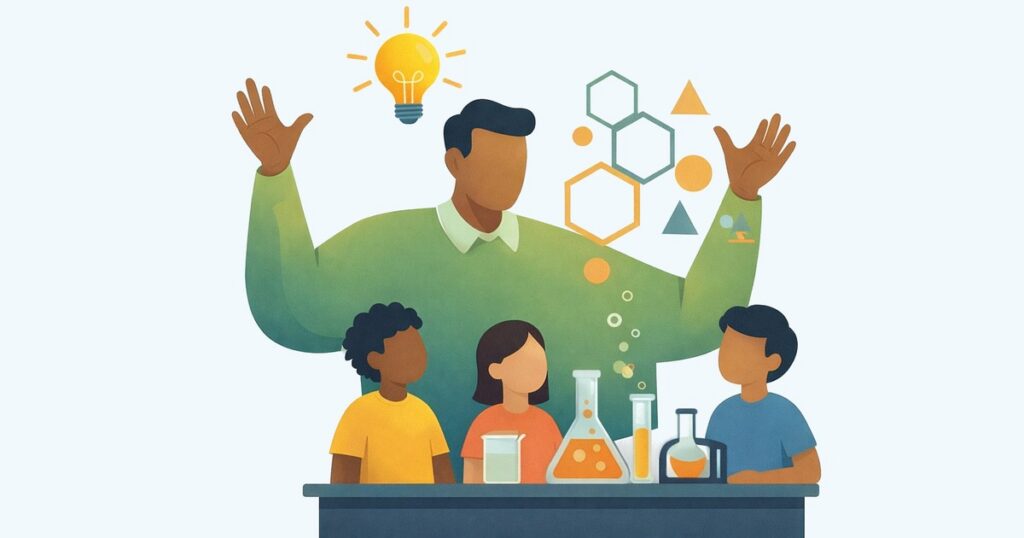
As we enhance the accessibility of our inquiry-based STEM simulations and integrate generative AI into our learning platforms, we’re constantly evaluating and leveraging emerging technologies to improve teaching and learning. Recent work has led to an exciting convergence and potentially transformative insight surrounding these two goals. The representations needed for a large language model (LLM) […]

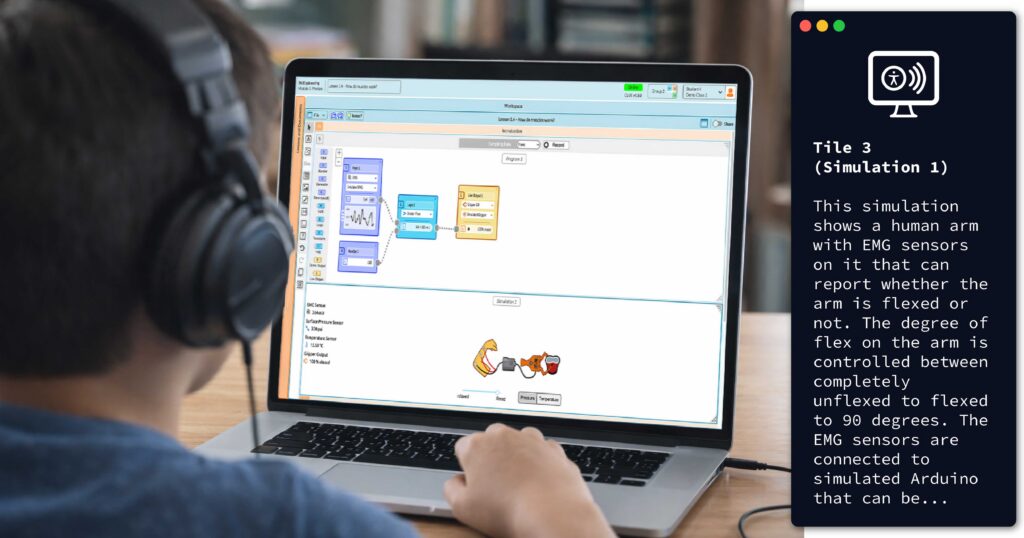
The Concord Consortium has developed hundreds of STEM simulations to engage students in the NGSS science and engineering practices—from asking questions and defining problems to developing and using models, planning and carrying out investigations, and analyzing and interpreting data. These simulations—covering everything from genetics to plate tectonics, diffusion, protein folding, the underpinnings of AI, and […]
As part of our YouthQuake project, funded by the National Science Foundation, we developed a five-activity online module that guides students through a series of investigations of earthquake risks and hazards. In addition to investigating the science of earthquakes and how to develop block coding to model land movement, students learn about related careers as […]
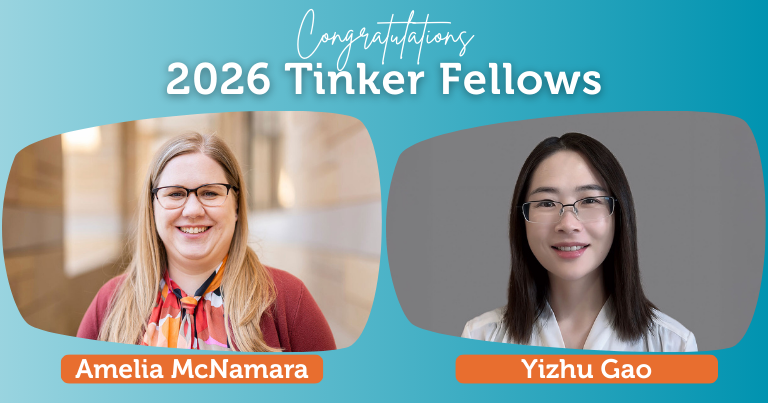
The Robert F. Tinker Fellows Program aims to promote innovation, creativity, and cross-disciplinary conversations. We’re thrilled to announce that two 2026 Tinker Fellows will focus on innovations in artificial intelligence (AI) to help transform teaching and learning. Amelia McNamara will explore how custom AI models can support teachers’ and students’ critical thinking and data science […]

Want to introduce data science with CODAP to your middle and high school students? Through a partnership with Bootstrap, you can get started with a free web-based set of materials. Developed by the Bootstrap team, the Data Literacy curriculum is a comprehensive, flexible data literacy course designed for students in grades 7-9 that uses CODAP […]

This week, a major snowstorm stretching from Texas to Maine is forecasted to affect millions of people. Many people throughout the U.S. now face the same questions. Do I have time to run to the store for more groceries before the heaviest snow is going to fall? Is school going to be delayed or canceled? […]
Do you have a teacher you are thankful for? I know I do. The one who comes to mind today is my 10th grade math teacher, Mr. Scheib. I had always enjoyed math and done well in it—until the third quarter of sophomore year. My mother took a second shift to help make ends meet. […]
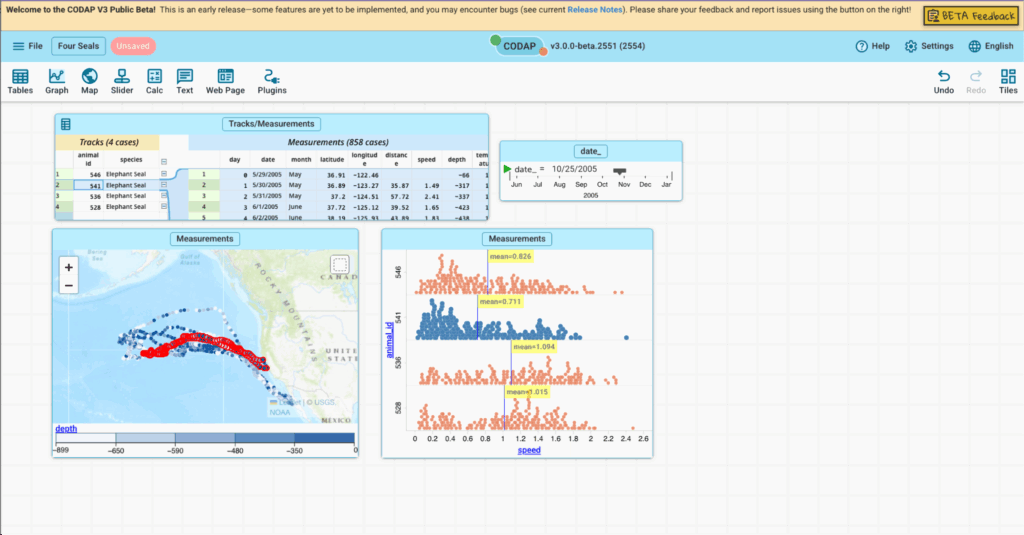
Our Common Online Data Analysis Platform (CODAP)—used by over 3.5 million users worldwide—is one of the most popular tools for data exploration. And now it’s better than ever! The beta release of CODAP V3 is officially live and ready for you to try. At the Concord Consortium, we like to dream big. One of our […]

The Concord Consortium is proud to announce a new grant from the National Science Foundation, titled Separating the Signal from the Noise (or SeismicML for short). This three-year project with Kent State University, the University of Washington, and the Anchorage School District will design, develop, and test computational tools that enable middle and high school […]