Every education project funded by the National Science Foundation (NSF) is subject to flexible yet high expectations for the proposed research. NSF is investing in our ability to develop new technology, new curriculum, and new research that contributes innovative ideas and products to further the field of STEM education. When we are awarded an NSF grant, it is our duty to learn something new and share that novel knowledge with the world.
Here, we report on our five-year NSF-funded GeoCode project.
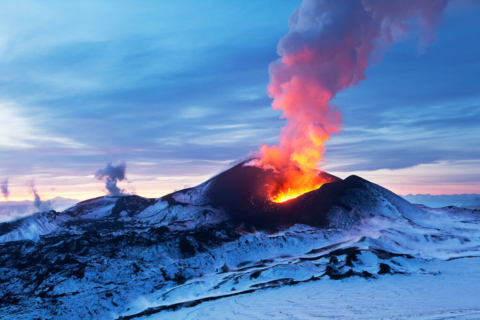
The goal of GeoCode was to design learning activities that integrate computational thinking with geoscience concepts in the authentic context of volcanic and seismic risk assessment. We wanted students to learn about the ways scientists explore how hazards form, how scientists think about impacts associated with hazards, and how they determine the risks associated with the hazards.
Since much of geohazard research involves computational analyses and visualizations of large datasets, we needed to figure out how to engage students in the computationally rich practices of modern geoscientists and how to design a programming environment that clearly visualizes scientific phenomena. We also needed to know what support teachers needed in order to introduce this new approach to teaching about geohazards to students.
With the help of practicing scientists, including volcanologists at the University of South Florida and a seismologist at Earthscope Consortium, we created the GeoCoder, an innovative block-based programming environment that allows students to manipulate scientific-grade tephra dispersion equations and land deformation models, plot GPS data, and run Monte Carlo simulations to predict risk. The model’s design—linking the block code and the visual representations of scientific phenomena—is the key innovation.
The GeoCoder allows students to run simulations with multiple inputs, create visualizations of large datasets, analyze data and models in order to develop scientific explanations, and design experiments to answer scientific questions. The wording of the code blocks, or syntax, helps students bridge the gap between the science concept they are investigating and the computational processes they need to carry out. In addition, to help students make the connection between inputs and outputs, each block used in the program workspace has a corresponding visual output.
We embedded the GeoCoder into two week-long curriculum modules, “Assessing Volcanic Hazards and Risk with Code” and “Assessing Seismic Hazards and Risk with Code.” Thanks to the many teachers who piloted these modules in their classrooms and provided invaluable feedback, we were able to implement and iterate on these modules to improve student learning.
Research results
By analyzing student responses within the modules and their comments in post-module surveys, as well as teacher feedback throughout the implementation process, we’ve learned a great deal about how to support students and teachers in computationally integrated science activities. Our research focused on the following questions:
- How can we design learning activities to engage students in authentic, computationally supported science investigations around natural hazards and risk?
- What do students learn from computationally supported science investigations in terms of science content as well as practices, i.e., experimentation, data analysis and visualization, and risk modeling?
- What did students find valuable in using computational methods for carrying out inquiry-based investigations and why? What did they find challenging?
- What do teachers think the advantages of the GeoCode modules are as compared to more traditional natural hazards curriculum?
First, we learned that when students use the modules, they significantly improve in both scientific and computational reasoning around geologic hazards and risk. Students exhibited more sophisticated reasoning in computational practices such as experimentation, data visualization and interpretation, and risk modeling after completing the modules. Students’ improvement in computational thinking from pre- to post-test shows that these practices can be learned at the same time as science concepts without inhibiting the learning of either aspect.
Second, we learned that students need several supports embedded in the modules to learn the practices and tools of scientists. Students learn best when there are multiple forms of visual representations, clear connections between block code and its output, and clear instructions on how to carry out investigations. For example, early on it became clear that students need a lot of support when learning how to code and understanding the function of new code blocks. Our first curriculum design did not include exact directions for how to build the code on each page, but rather suggested the general function of what the code should do. This vague instruction on setting up the code was too big a leap for many students, so we pivoted to providing clear step-by-step directions for building code. Still, some post-activity surveys show that over 30% of students self-reported that coding was their main challenge in working through the activity. According to teachers, the biggest challenge for students was that they would not read the directions of how to set up the code in order to conduct the investigations.
Third, we learned that over 80% of students recognized the different ways in which block coding can support them in their scientific investigations. Students reported ways in which the GeoCoder helped them build knowledge, visualize phenomena, and recognize how the use of code aligned with the purpose of the investigation. As scientific inquiry is actualized when the investigator purposefully manipulates models in order to gain insights about the phenomenon under study, it is an important finding that students were able to recognize the purpose of their investigation.
Fourth, we learned from teachers that the greatest advantage of the GeoCode modules was the use of large, real-world datasets. Giving students the opportunity to analyze and visualize these datasets allows them to participate in authentic geoscience practices in the classroom. Coding helps students change different variables in the visualization of the data deliberately and systematically and see immediate changes in the outcomes, thus better helping them understand the cause and effect relationships in a complex system. Teachers told us:
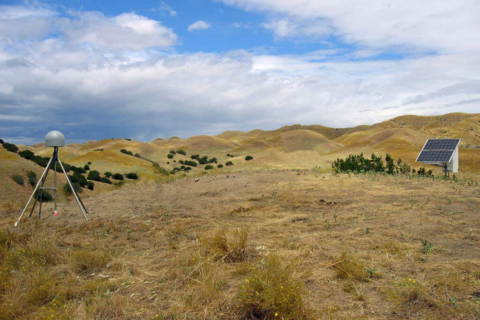
- “Using real data and visualizing GPS stations especially in California made this real and tangible for our students.”
- “I believe that these modules did provide a great deal of understanding of how and why earthquakes occur in regions near seismic activity. The connection with the real-time available data provided authentic inquiry and the realization that this type of Earth process is constantly occurring around the world and indicates an active earth.”
- “I think it helped to solidify how difficult it is to collect and analyze ambiguous data in the real world. Students struggle with the idea that data is often confounding and is not linear like how it is often presented in lectures.”
We are thrilled that our work is making an impact, and we are excited that we will have the opportunity to continue researching how students can use computational code to explore earthquake hazards. The GeoCode project inspired our new YouthQuake project, which was recently funded by NSF’s ITEST program. YouthQuake will use the seismic version of the GeoCoder and the “Assessing Seismic Hazards and Risk with Code” module to co-design computational seismic investigations with urban Hispanic and African American middle school students and teachers in central California.
The GeoCode modules and a full suite of supporting resources to implement them in your classroom are accessible for free in our STEM Resource Finder. Please feel free to reach out to us if you have questions or comments about our resources or research.

