The everyday work of modern seismologists—the scientists who study earthquakes, hazards, and risks—exists right at the intersection of two NGSS practices: “Analyzing and Interpreting Data” and “Using Mathematics and Computational Thinking.” Seismologists collect huge amounts of data from satellites, remote sensors, and GPS networks in order to monitor Earth’s surface for signs of land movement and deformation. And they use code to filter, organize, and interpret this data with simulations and models to figure out what’s happening on the surface of our dynamic planet.
The goal of the GeoCode project was to translate these computational and modeling practices to a level suitable for middle and high school students, so they could experience the authentic practices of scientists. To do so, we created a block-based computational tool called GeoCoder that allows students to build code, manipulate simulations, and visualize data to help them understand the factors that influence earthquake occurrence and severity.
The design of the GeoCoder model foregrounds three aspects in parallel: block code, scientific representations, and science content knowledge.
Learning three things at once? Sounds hard. And when those three things have been proven to give students trouble when learned separately? Sounds even harder. But in the practices of modern seismologists, coding, interpretation of representations, and development of content knowledge are inextricably linked together. You can’t have one without another. Each aspect allows a deeper understanding of the others because they provide feedback to each other. A deeper understanding of the computational processes can produce better interpretation of the visualization and deepen scientific insights that can be derived from it. And a deeper understanding of the science content can lead to more robust computational methods, which will produce more accurate representations. And so on and so on.
Below, we describe one activity from the “Assessing Seismic Hazards and Risk with Code” module to highlight the links between the code, the visual representations, and the science content. Follow along here and then try the activity yourself.
Page 1
The framing question is “Will land deformation in California continue forever?” To begin their investigation, students use the Seismic Explorer to look at earthquakes along the San Andreas fault and consider how they relate to land deformation along the fault.
Page 2
Students are now challenged to use code to create a simulation of deformation. Figure 1 shows the GeoCoder with block code on the left and a visual representation of three GPS stations on two different tectonic plates on the right. To help students connect the code to the visualization, every block in the code has a visual output associated with it. (See the arrows added to the screenshot in Figure 1.)
When students click the “Run” button, GeoCoder executes the code on the left and students witness the land surface deformation on the right, corresponding to values they input as the plates move over time. In this example, the student set the plate movement at 32 mm/year and 45 mm/year, respectively, and the duration to 150 years. As the simulation runs, the lines in the triangle show how the land along the fault deforms over time as the two plates move north and south.
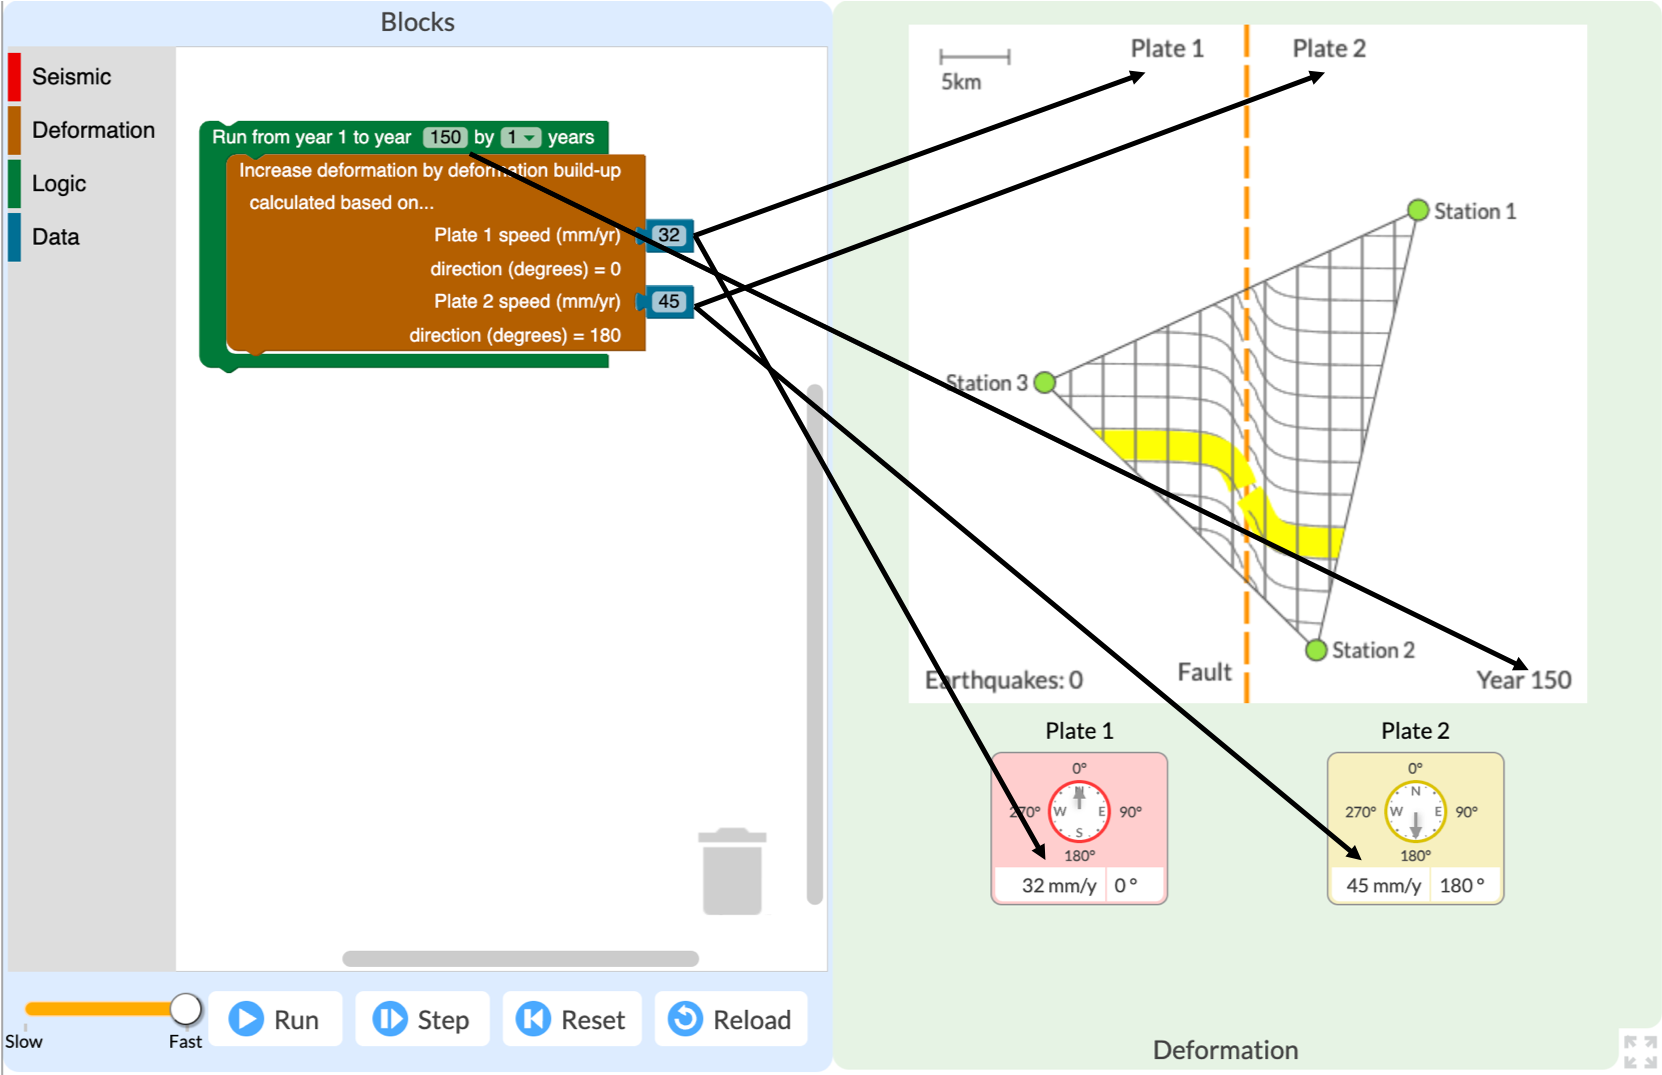
Figure 1. GeoCoder with block code (left) and a visual representation of two tectonic plates (right). The code specifies that Plate 1 is moving North at 32 mm/year while Plate 2 is moving South at 45 mm/yr.
Page 3
Students now have access to two new code blocks. The “create deformation over time” block produces the skeleton of a graph below the visualization (Figure 2, left). The “plot deformation on the graph” block adds a green line, representing deformation, to the graph (Figure 2, right). Without the block, you can’t see deformation in the graph. Students experiment with the code to explain how the graph is related to the simulation. In this way, students are gradually introduced to these different elements and prompted to explain what they are seeing.
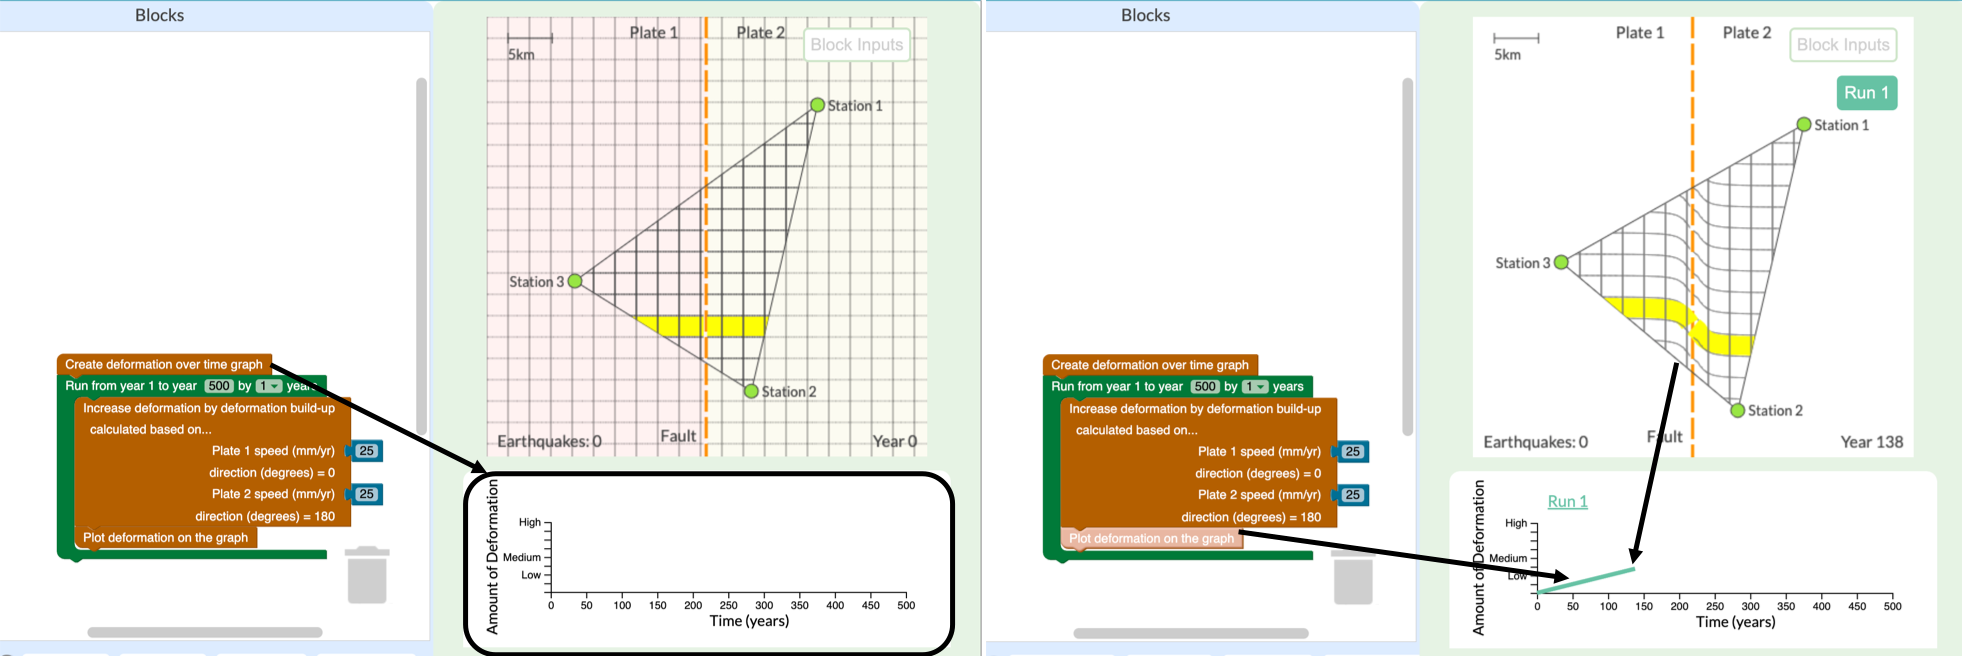
Figure 2. A skeleton of a graph of deformation over time (left). The green line in the graph (right) representing the amount of deformation is added by adding another block of code.
Page 4
The final sequence of code for this activity is constructed and another visual element is added. It is here where the wording of the code blocks, or syntax, especially helps students connect the science concept they’re investigating with the code they’re creating and the visual representation they’re watching.
The conditional statement at the bottom of the code in Figure 3 uses scientific terms to describe what’s going to happen. In natural language, it says, “If the amount of deformation in the model is greater than the maximum amount of deformation the plates can undergo as determined by the friction level [set by students], then an earthquake will occur in the Deformation Simulation. If not, loop back to the beginning and run through another year of simulated plate movement.” Students thus learn to use a conditional block to program earthquakes into the simulation.
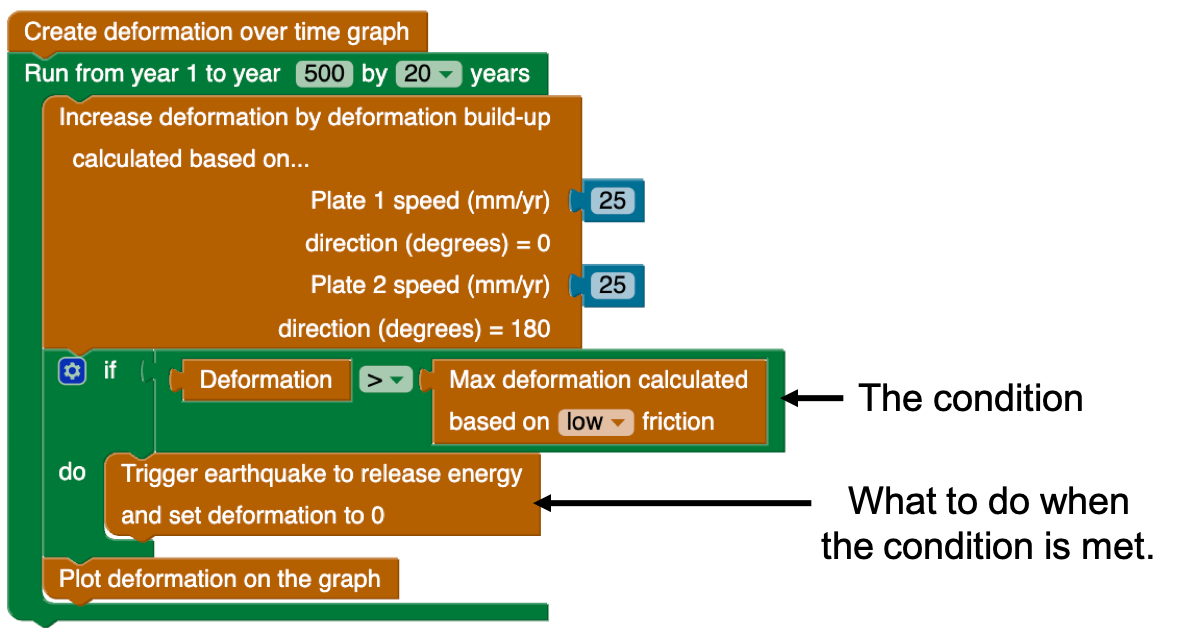
Figure 3. Students learn about conditional (if/then) statements in GeoCoder.
The earthquakes and their release of deformation are represented both in the simulation and the graph. Deformation builds up until an earthquake occurs, which releases the deformation and resets it to zero. This is represented in the grid by the lines snapping apart and becoming straight again, though offset. In the graph, deformation drops to zero. Immediately after the earthquake, the two plates continue to move after an earthquake and deformation immediately begins to build up again. This process of deformation buildup and release is called the earthquake cycle.
Figure 4. The GeoCoder shows deformation buildup and release.
Through this scaffolded investigation, students add new blocks to the code that change the visualization and reinforce new science concepts as they investigate real-world earthquake phenomena. In the rest of the activity, they use this code to explore why some parts of California experience many frequent, small earthquakes while other areas haven’t had one in many years and are in danger of experiencing a severe earthquake.
The practices of coding, interpreting representations, and developing scientific content knowledge are essential components of scientific inquiry. Seismologists routinely combine all three. With GeoCoder, students can, too.
Want to try it in your classroom? The “Assessing Seismic Hazards and Risk with Code” module is freely available and comes with a comprehensive Teacher Edition, Class Dashboard, code cheat sheet, standards alignment, and other resources. If you’d like to learn about opportunities for testing Earth science curriculum, please complete this interest survey. We look forward to working with you!