Linsey Brennan is a doctoral student at Michigan State University and a researcher on the Multilevel Computational Modeling Project.
Chemistry teachers Scott Hanson and Tim Muhich have used SageModeler to help students model systems and explain real-world phenomena for the past four years. According to the pair of teachers at the Battle Creek Area Math and Science Center in Battle Creek, Michigan, their students’ learning rose to a new high this year, all thanks to the Class Dashboard.
Students work in pairs to build, revise, and evaluate system models using SageModeler. They learn about new variables and are able to make new cause and effect relationships between variables as they engage in hands-on experiments and interact with computer simulations.
To represent key components of a system, students first place nodes on the SageModeler canvas, then link the nodes together, specifying the semi-quantitative effect of one node on another to describe the web of relationships. When the model is simulated, the structure and the set of relationships between model components dictate model behavior.
We recently developed algorithms that automatically generate tags about a model’s structure, including branching chains, linear chains, and feedback loops. We then added that information to the Class Dashboard, which means that teachers can now view their students’ system models in real time.
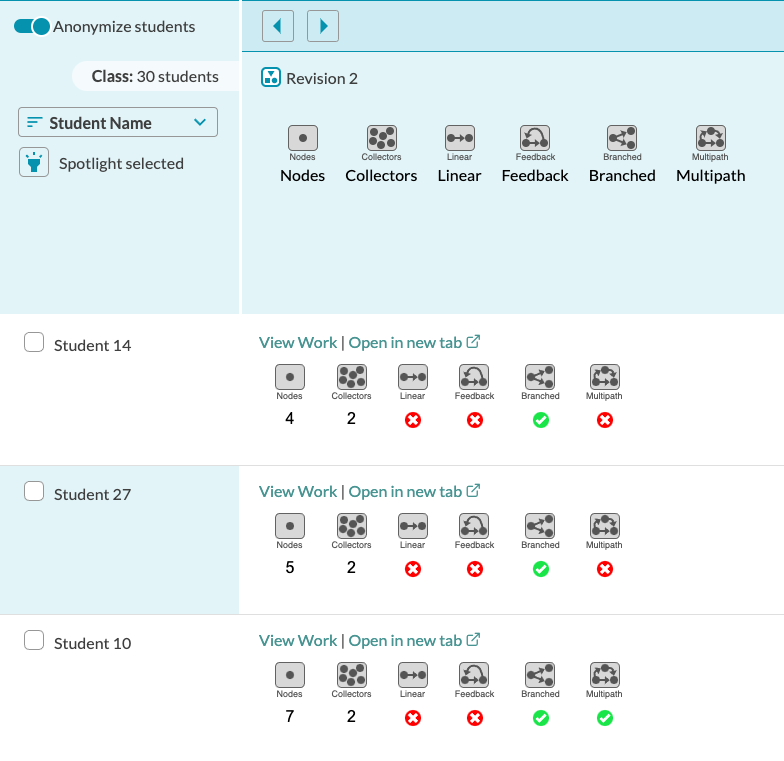
Anonymous view of students’ system models, showing particular model features, including number of nodes, number of collectors, and whether the models are linear, branched, or multipath, and if they can contain feedback structures.
Muhich and Hanson were able to display the anonymized dashboard during class discussions and ask students to look at overall class trends in model features. Students discussed these trends and used them to select models with interesting features to analyze.
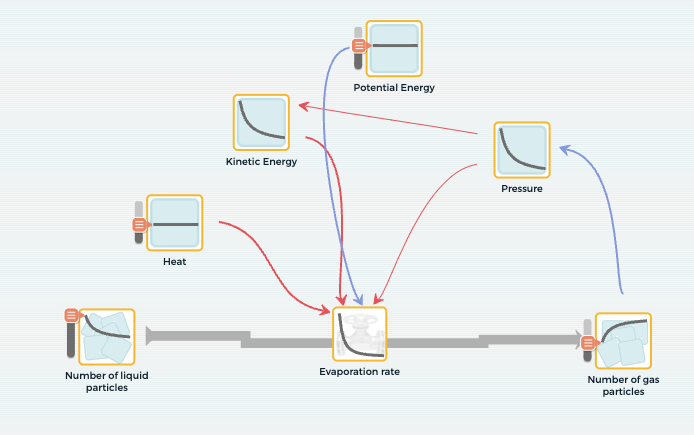
Student model that includes a feedback loop.
For instance, they were able to select a model that included feedback to display and follow a particular feedback loop, and show that the output of that loop was exponential decay. The dashboard also offered Muhich and Hanson the opportunity to quickly respond to the needs of their class by scanning the dashboard and selecting models with features where students needed additional support.
Muhich and Hanson are thrilled with how things turned out in the classroom. They say that incorporating the Class Dashboard into their instruction “allowed us to have different conversations with the students and prepare them better for the different types of models they could create.” They believe that sharing model structure with students by projecting the anonymized dashboard screen in front of their classes helped standardize vocabulary related to model structure as students began to use terms like “nodes” and “feedback” more regularly and confidently.
Muhich and Hanson summed up their experience: “We saw better models, better class discussions, and better peer reviews.” Learn more about the Class Dashboard in our user guide.