
Under the Hood: Characterizing Systems Model Structure
SageModeler, our free, web-based systems modeling tool developed with our partners at the CREATE for STEM Institute at Michigan State University, supports middle and high school students and teachers in understanding systems and system modeling, one of the seven crosscutting concepts in the Next Generation Science Standards. With new automated model tagging in SageModeler, we can now provide teachers more information about their students’ understanding of systems.
To represent key components of a system, students first place nodes on the SageModeler canvas, then link the nodes together, specifying the semi-quantitative effect of one node on another to describe the web of relationships. They are thus able to build a computational model of their own conceptual model, then simulate the model and generate output to compare to the real-world behavior of that system.
When simulated, the model’s structure and the set of relationships between model components dictate model behavior. To assist teachers and researchers in understanding certain characteristics of model structures, we developed algorithms that can automatically generate tags about a model’s structure, including branching chains, linear chains, and feedback loops.
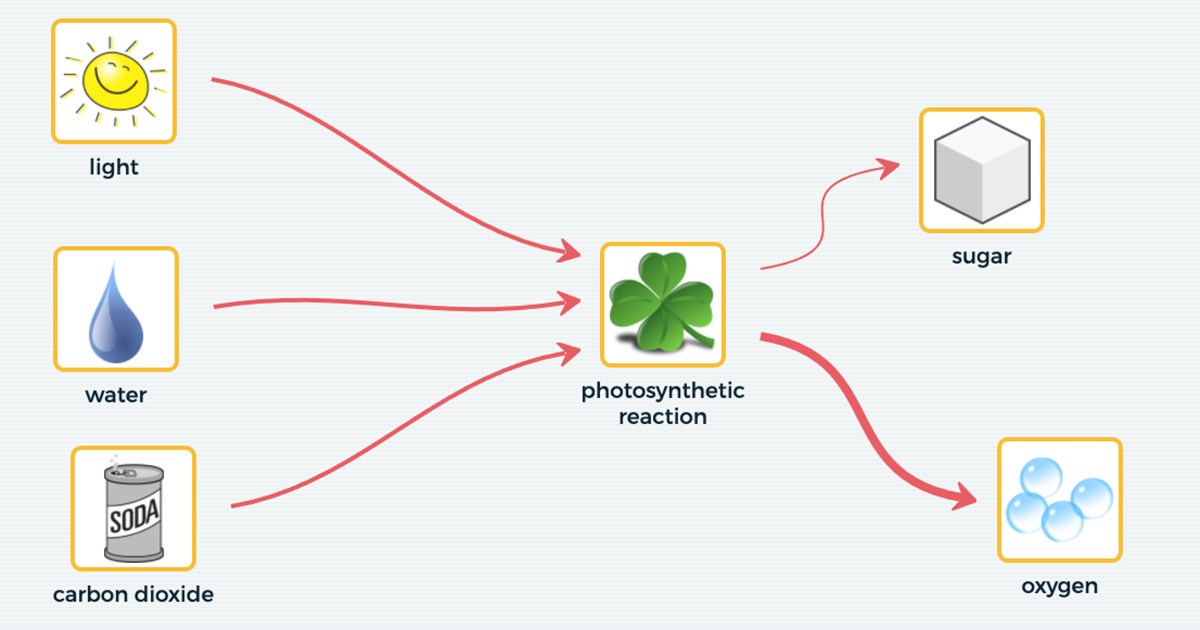
We started with an open-source graph introspection library called graphlib, which assumes graphs with structures consisting only of nodes and directed links (Figure 1). This graph is analogous to structures students make with a static equilibrium model in SageModeler (Figure 2).

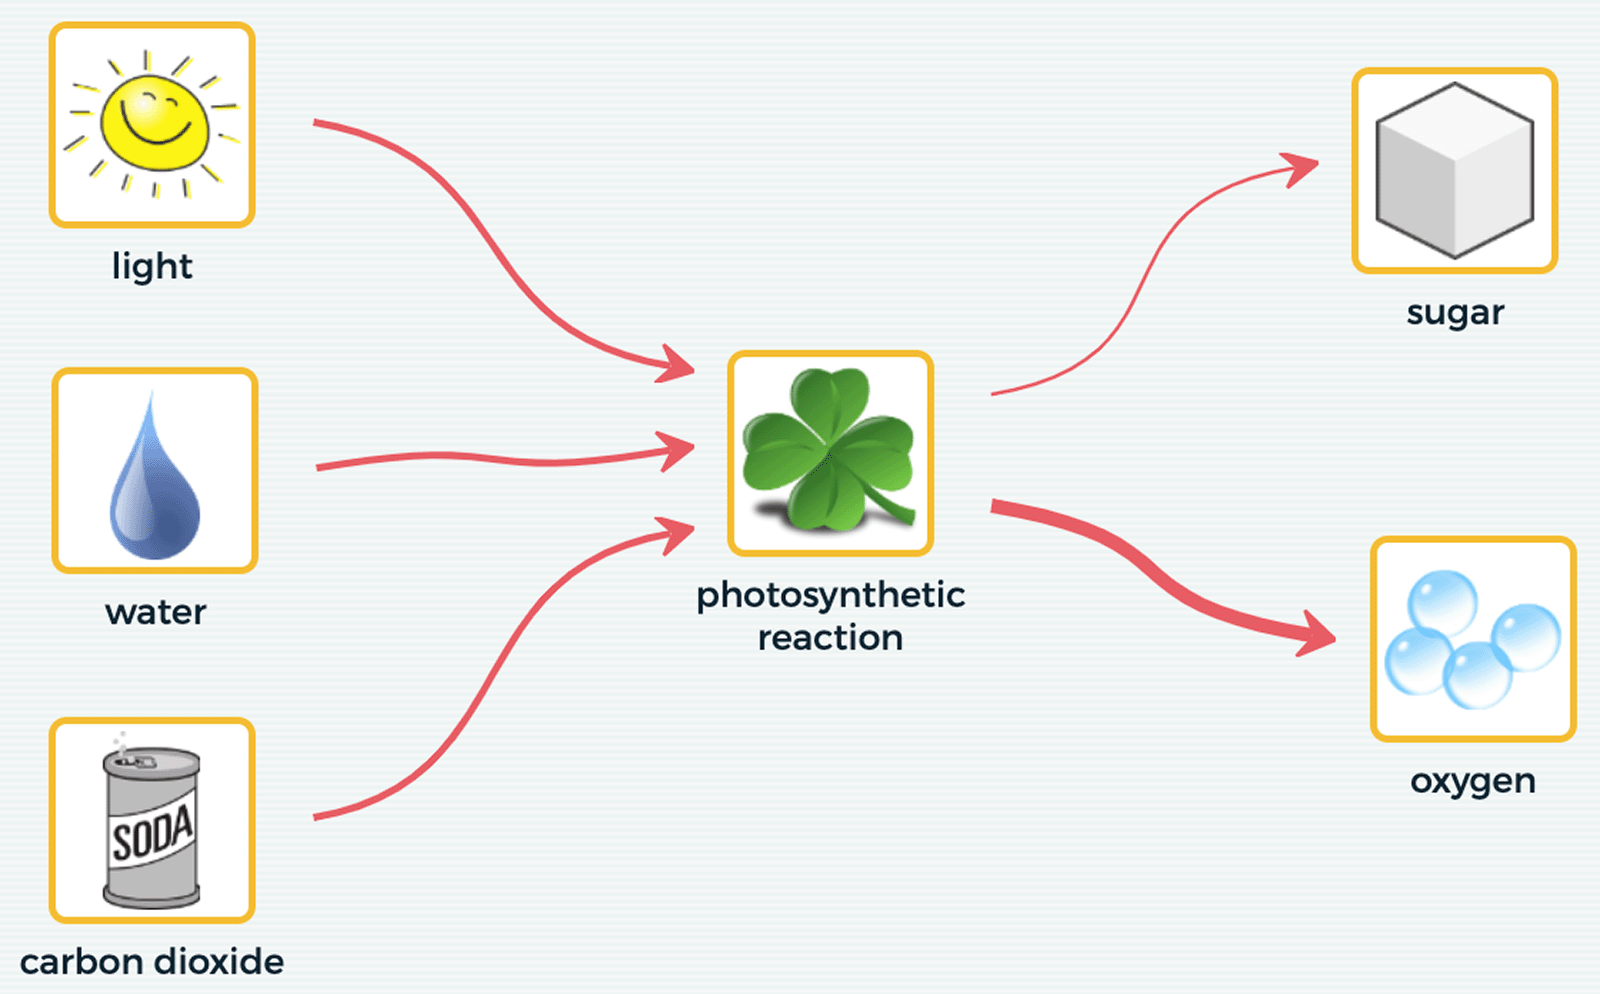
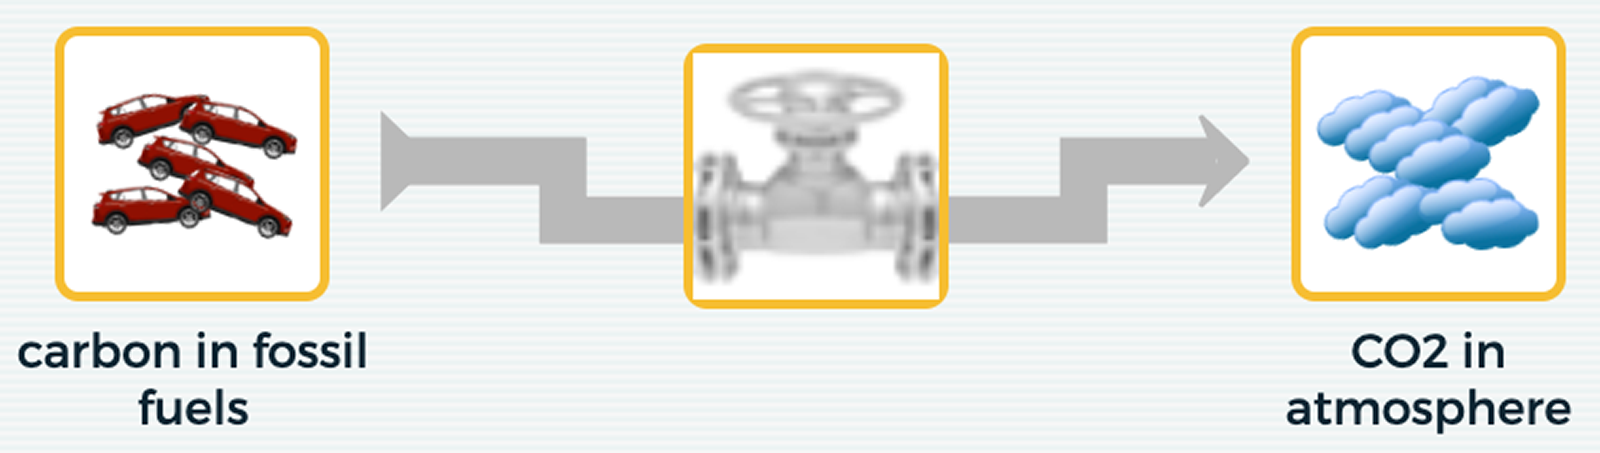
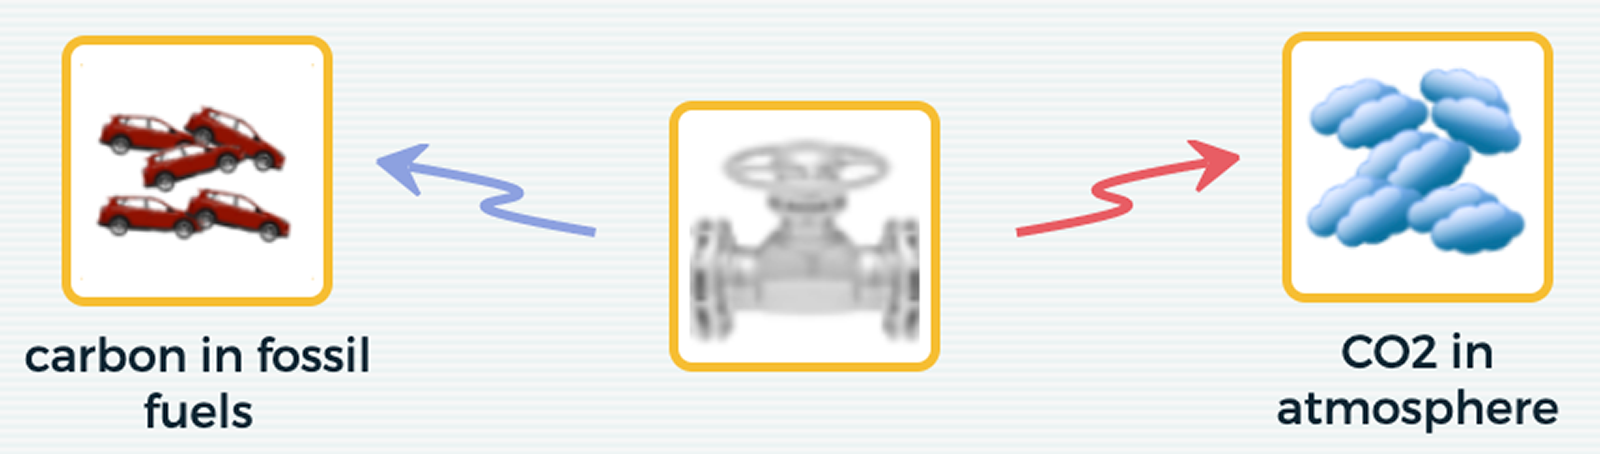
We extended the graphlib library and created our own open-source npm package to analyze dynamic time-based models in SageModeler, which include special variables called “collectors” (traditionally called stocks) and flows. Figure 3a shows a flow between two collectors. Notice the single arrow from one collector (carbon in fossil fuels) through the valve (which controls the rate of flow) to the second collector (CO2 in atmosphere). The valve node describes how much to subtract from the source collector, which is then added to the destination collector. In order to utilize features of standard graph analysis packages like graphlib, we first convert such structures behind the scenes to something that is semantically identical but represented using just nodes and directed arrows (Figure 3b). This allows us to automate the process of tagging particular characteristics in the models.
Students build and revise their models throughout our SageModeler curricular units. It would be daunting to analyze the thousands of student models created across our research cohort of teachers. Using the new model tagging algorithms, we can process large quantities of models and learn how model structures tend to evolve over the course of model revisions as well as how different scientific phenomena (e.g., predator and prey or chemical reactions) elicit different kinds of model structures.
Automated model tagging can also help teachers, allowing them to scan a list of student models and know something about the structure of each model. Did students use feedback loops to show exponential or logarithmic growth? Are models branched to show two outputs? Selecting and discussing various ways students model phenomena can propel class discussion.
Our goal is to support student understanding of modeling and systems. As machine learning continues to develop, model tags may go beyond simple structures and include key ideas represented (or missing from) models.
Dan Damelin (ddamelin@concord.org) is a senior scientist.
This material is based upon work supported by the National Science Foundation under grant DRL-1842035. Any opinions, findings, and conclusions or recommendations expressed in this material are those of the author(s) and do not necessarily reflect the views of the National Science Foundation.