The authors of the 1972 book entitled The Limits to Growth set out to answer a critically important question. Can Earth sustain a human population that pursues a goal of continual economic growth?
Based on a computer model they created, their answer was both guarded and cautionary: “If the present growth trends in world population, industrialization, pollution, food production, and resource depletion continue unchanged, the limits to growth on this planet will be reached sometime within the next one hundred years. The most probable result will be a rather sudden and uncontrollable decline in both population and industrial capacity.”
Not surprisingly, the book was extremely controversial.
Critics argued that the model made predictions based on false assumptions and that it was much too simple to represent the intricate dynamics of an extremely complex world correctly.
The criticism did not faze the authors, however. Donella Meadows, Dennis Meadows, Jørgen Randers, and William Behrens III were students of Jay Forrester at MIT.
An electrical engineer by training, Forrester recognized that many of the relationships found in social systems are also seen in electrical circuits and systems. In particular, he saw feedback loops — circular connections of cause and effect within the system — as the principal determinants of complex behavior in all systems, and he set out to develop computer software that could model this. This was the start of a brand new discipline known as system dynamics
Forrester’s pioneering work led to the development of the software and modeling approach used by the authors of The Limits to Growth. The approach was called system dynamics because it specifically examines the evolving changes in behavior that occur in complex systems as time passes.
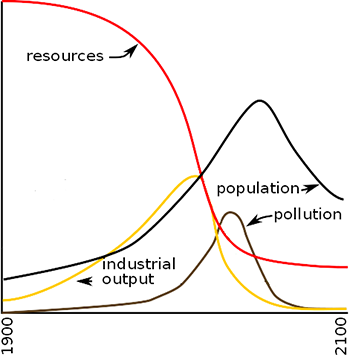
Graph of change over time in the world resource model from The Limits to Growth.
The graph above shows the results of one of the many simulations in The Limits to Growth. Its underlying assumptions were that humanity would undergo no significant changes in its early 1970’s approach to development, that economic growth would remain a priority, and that there would be no technological advances that could significantly change things.
I will leave it to you to decide if the trajectories shown make sense a half century after the graph was first created. What I want to focus on here is the simplicity of structure that generated these behaviors.
Using our system modeling software, SageModeler, I created a simple model of the four sectors of the world system examined by The Limits to Growth model: population, pollution, industrial output, and nonrenewable resources. Each sector can be considered independently, as shown in the causal map below. Components with images represent those parts of the system where materials move and accumulate. Those with blue boxes supply information about how the material movement will occur.
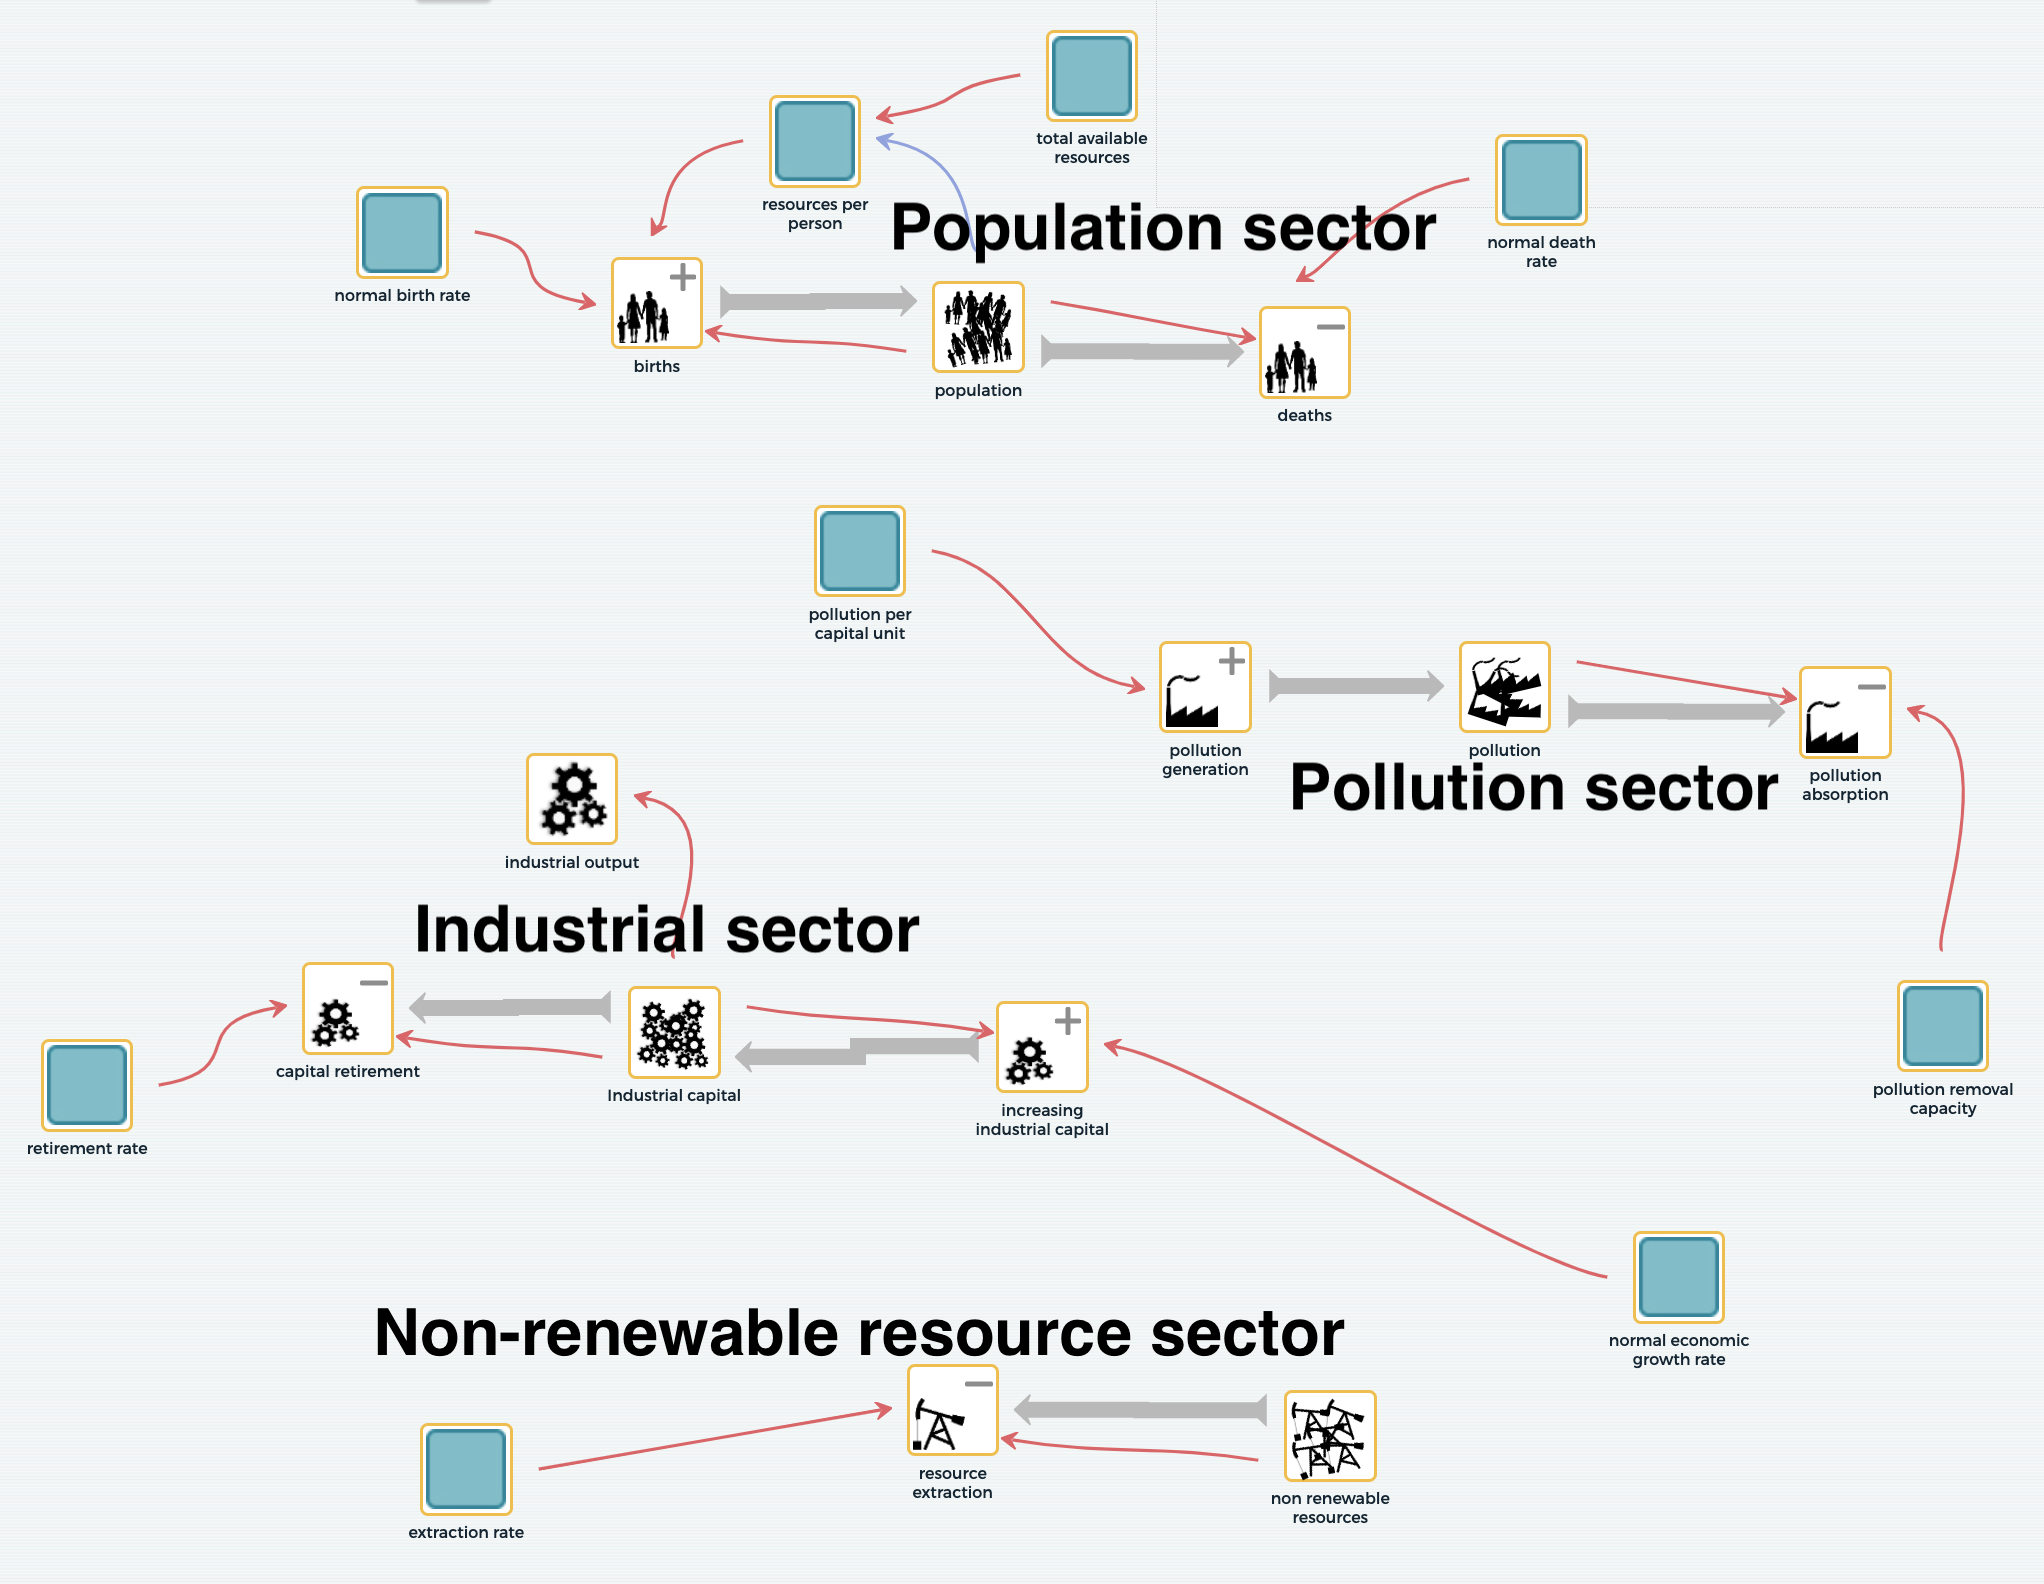
A causal map created in SageModeler of the four sectors of the world resource model from The Limits to Growth.
Open the model, then click SIMULATE in the upper right. Now, try moving sliders on the informational variables. You should see behaviors that make sense for each sector. For example, if you move the total available resources slider up, the population grows, though it will reach a limit. Industrial output grows exponentially, with output producing profit and profit creating more potential for growth. Pollution grows to reach a steady state, with pollution generation equaling absorption by the environment. Nonrenewable resources are depleted at a rate that depends in part on the amount of resources that are available.
All of these are behaviors you might have predicted when considering each sector separately. But what happens when they are all connected and there is some feedback within the system? Can you predict whether or not there will be a change in the model’s behavior? And if so, what will the change be?
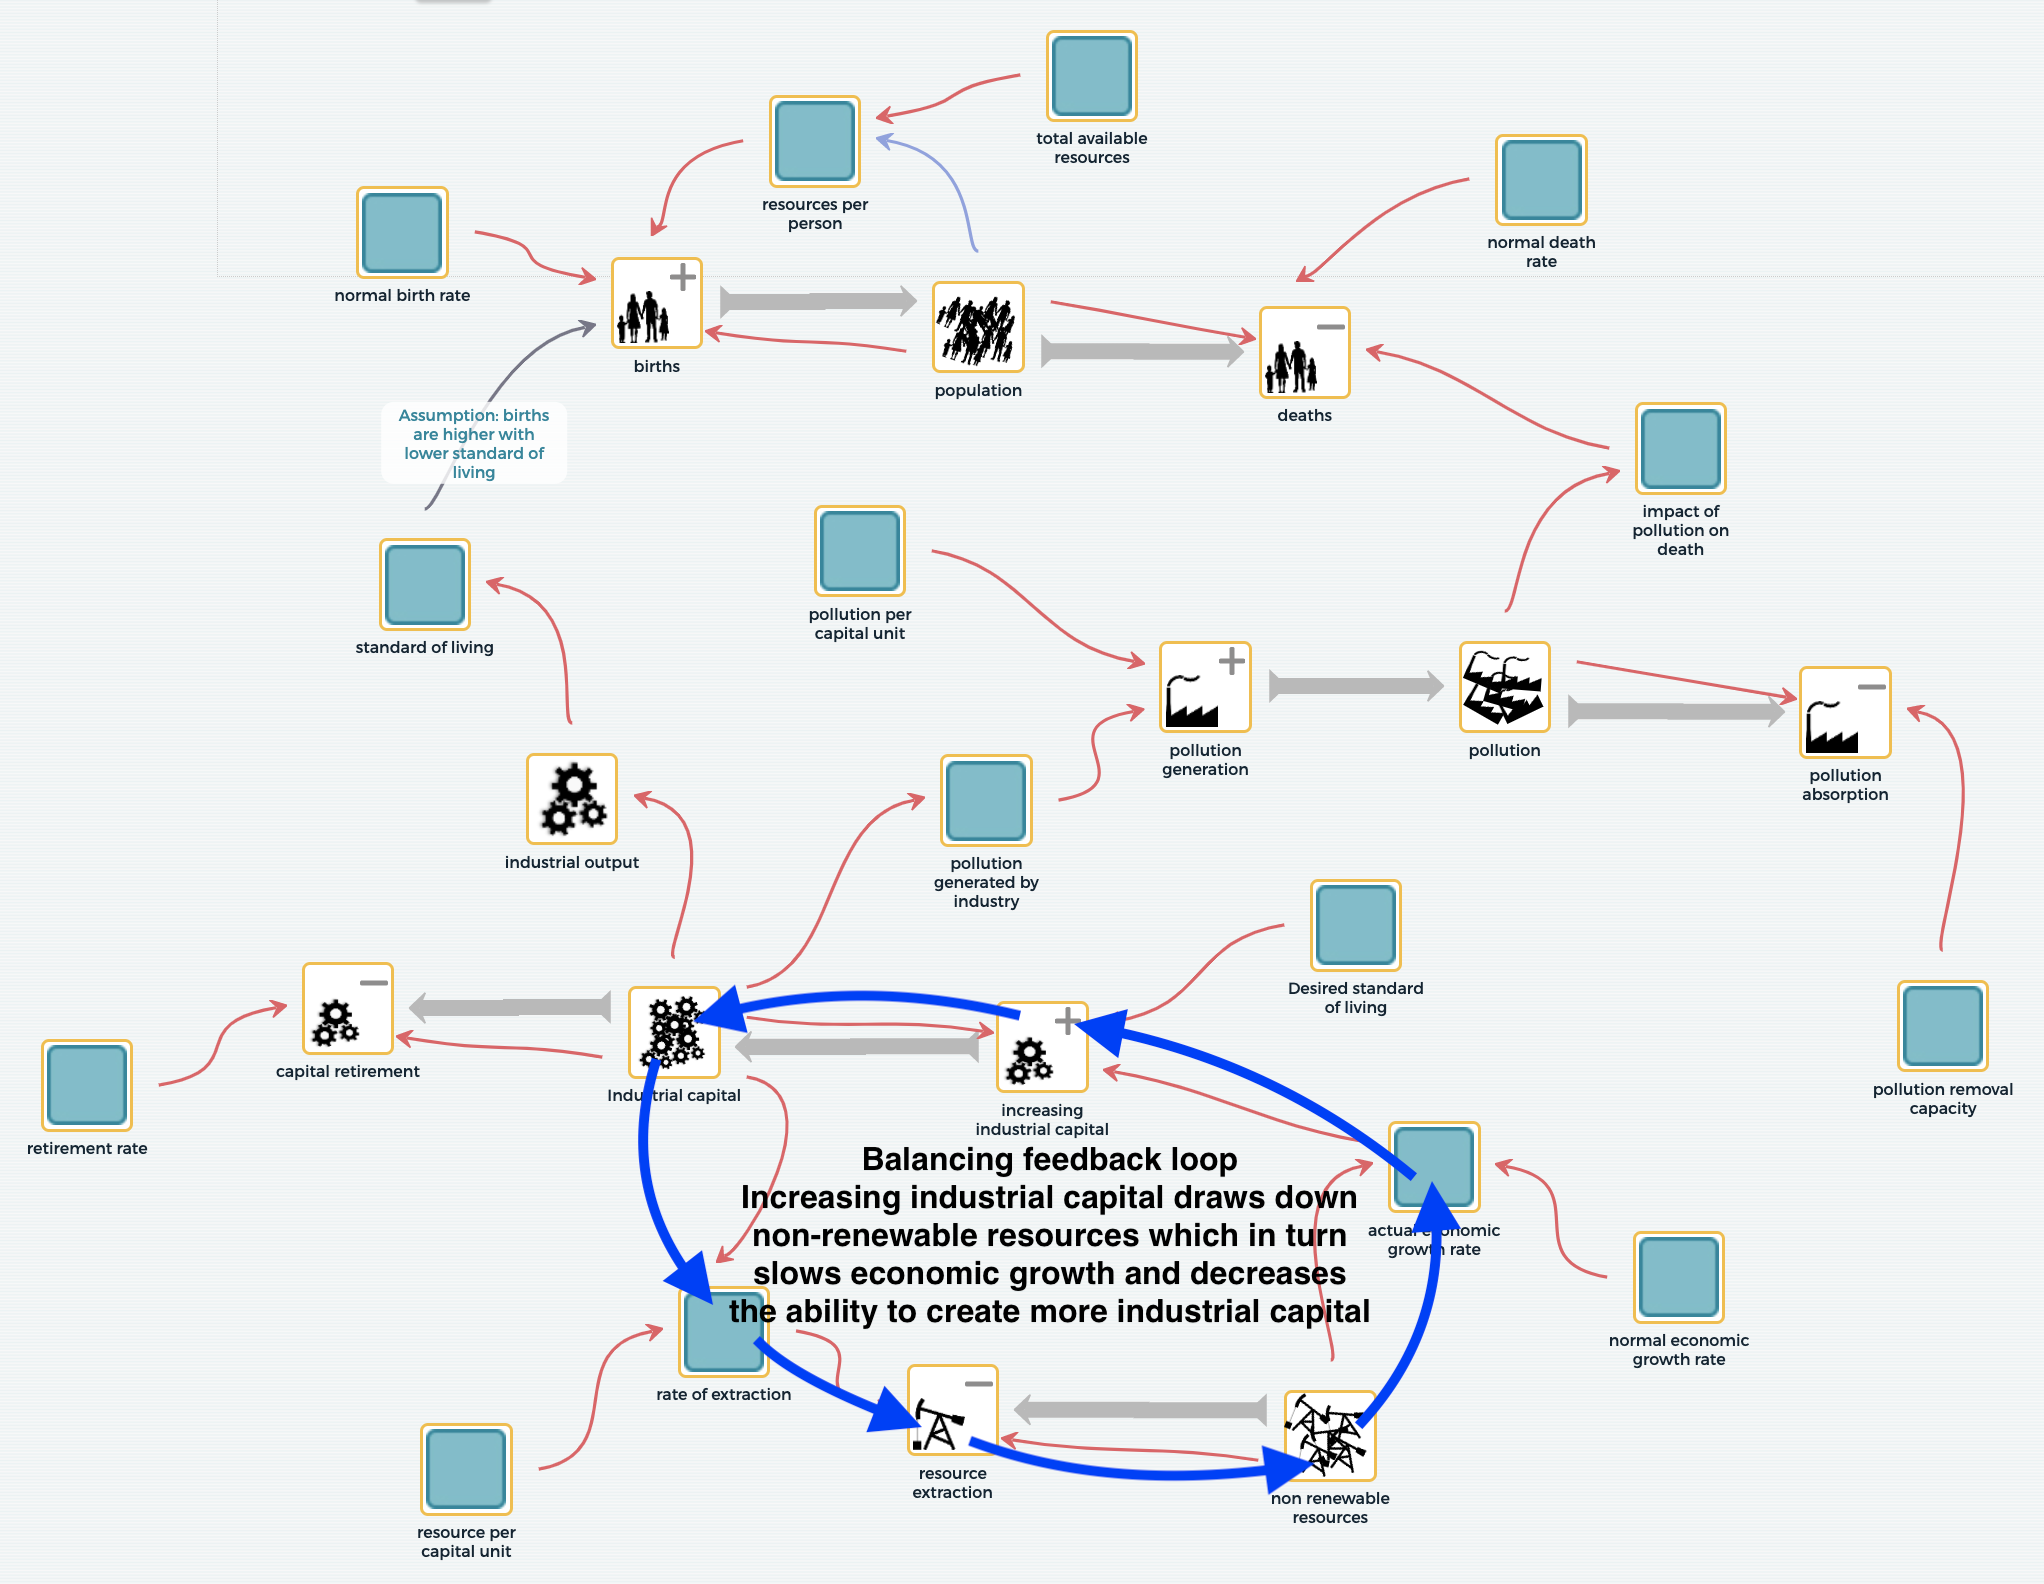
A model of the four sectors connected.
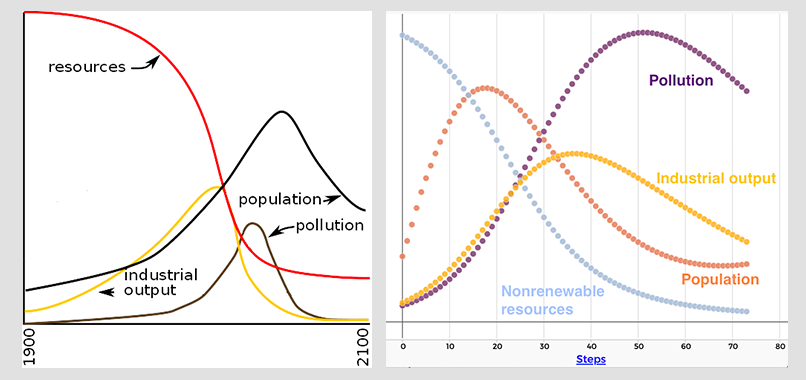
Output graphs from The Limits of Growth model (left) and SageModeler model (right).
In both simulations, population, pollution, and industrial output rise for a while, then drop off rather dramatically. Nonrenewable resources steadily decline. The two graphs show similar, but not identical behavior.
The 1971 Limits to Growth model, though much simpler than the world system, has many more variables than the SageModeler model, and its creators spent months researching and collecting real-world data in order to define the causal relationships in the model as accurately as possible. In the SageModeler version, causal relationships are only approximated.
Despite those differences, what is perhaps most striking is that the behavioral patterns of the primary variables from each sector are so similar. At first there is growth, but in all cases growth slows, tops out at a maximum value, and then declines.
Can the model structure help us to see why?
Tracing the feedback loop (blue arrows) gives some clues about what is going on. At first, there are lots of natural resources that can be extracted from the Earth and used to create industrial capital and capacity. Early growth is supported and the economy can expand as industrial capital and its production increase. But as resources decline, so does the fuel for the growing economy. The addition of new industrial capital begins to drop, old machinery is not replaced, workers are laid off without replacement, and soon enough industrial output begins to drop. The loop that began with an increase in industrial capital and output eventually reverses itself and causes a decline in output.
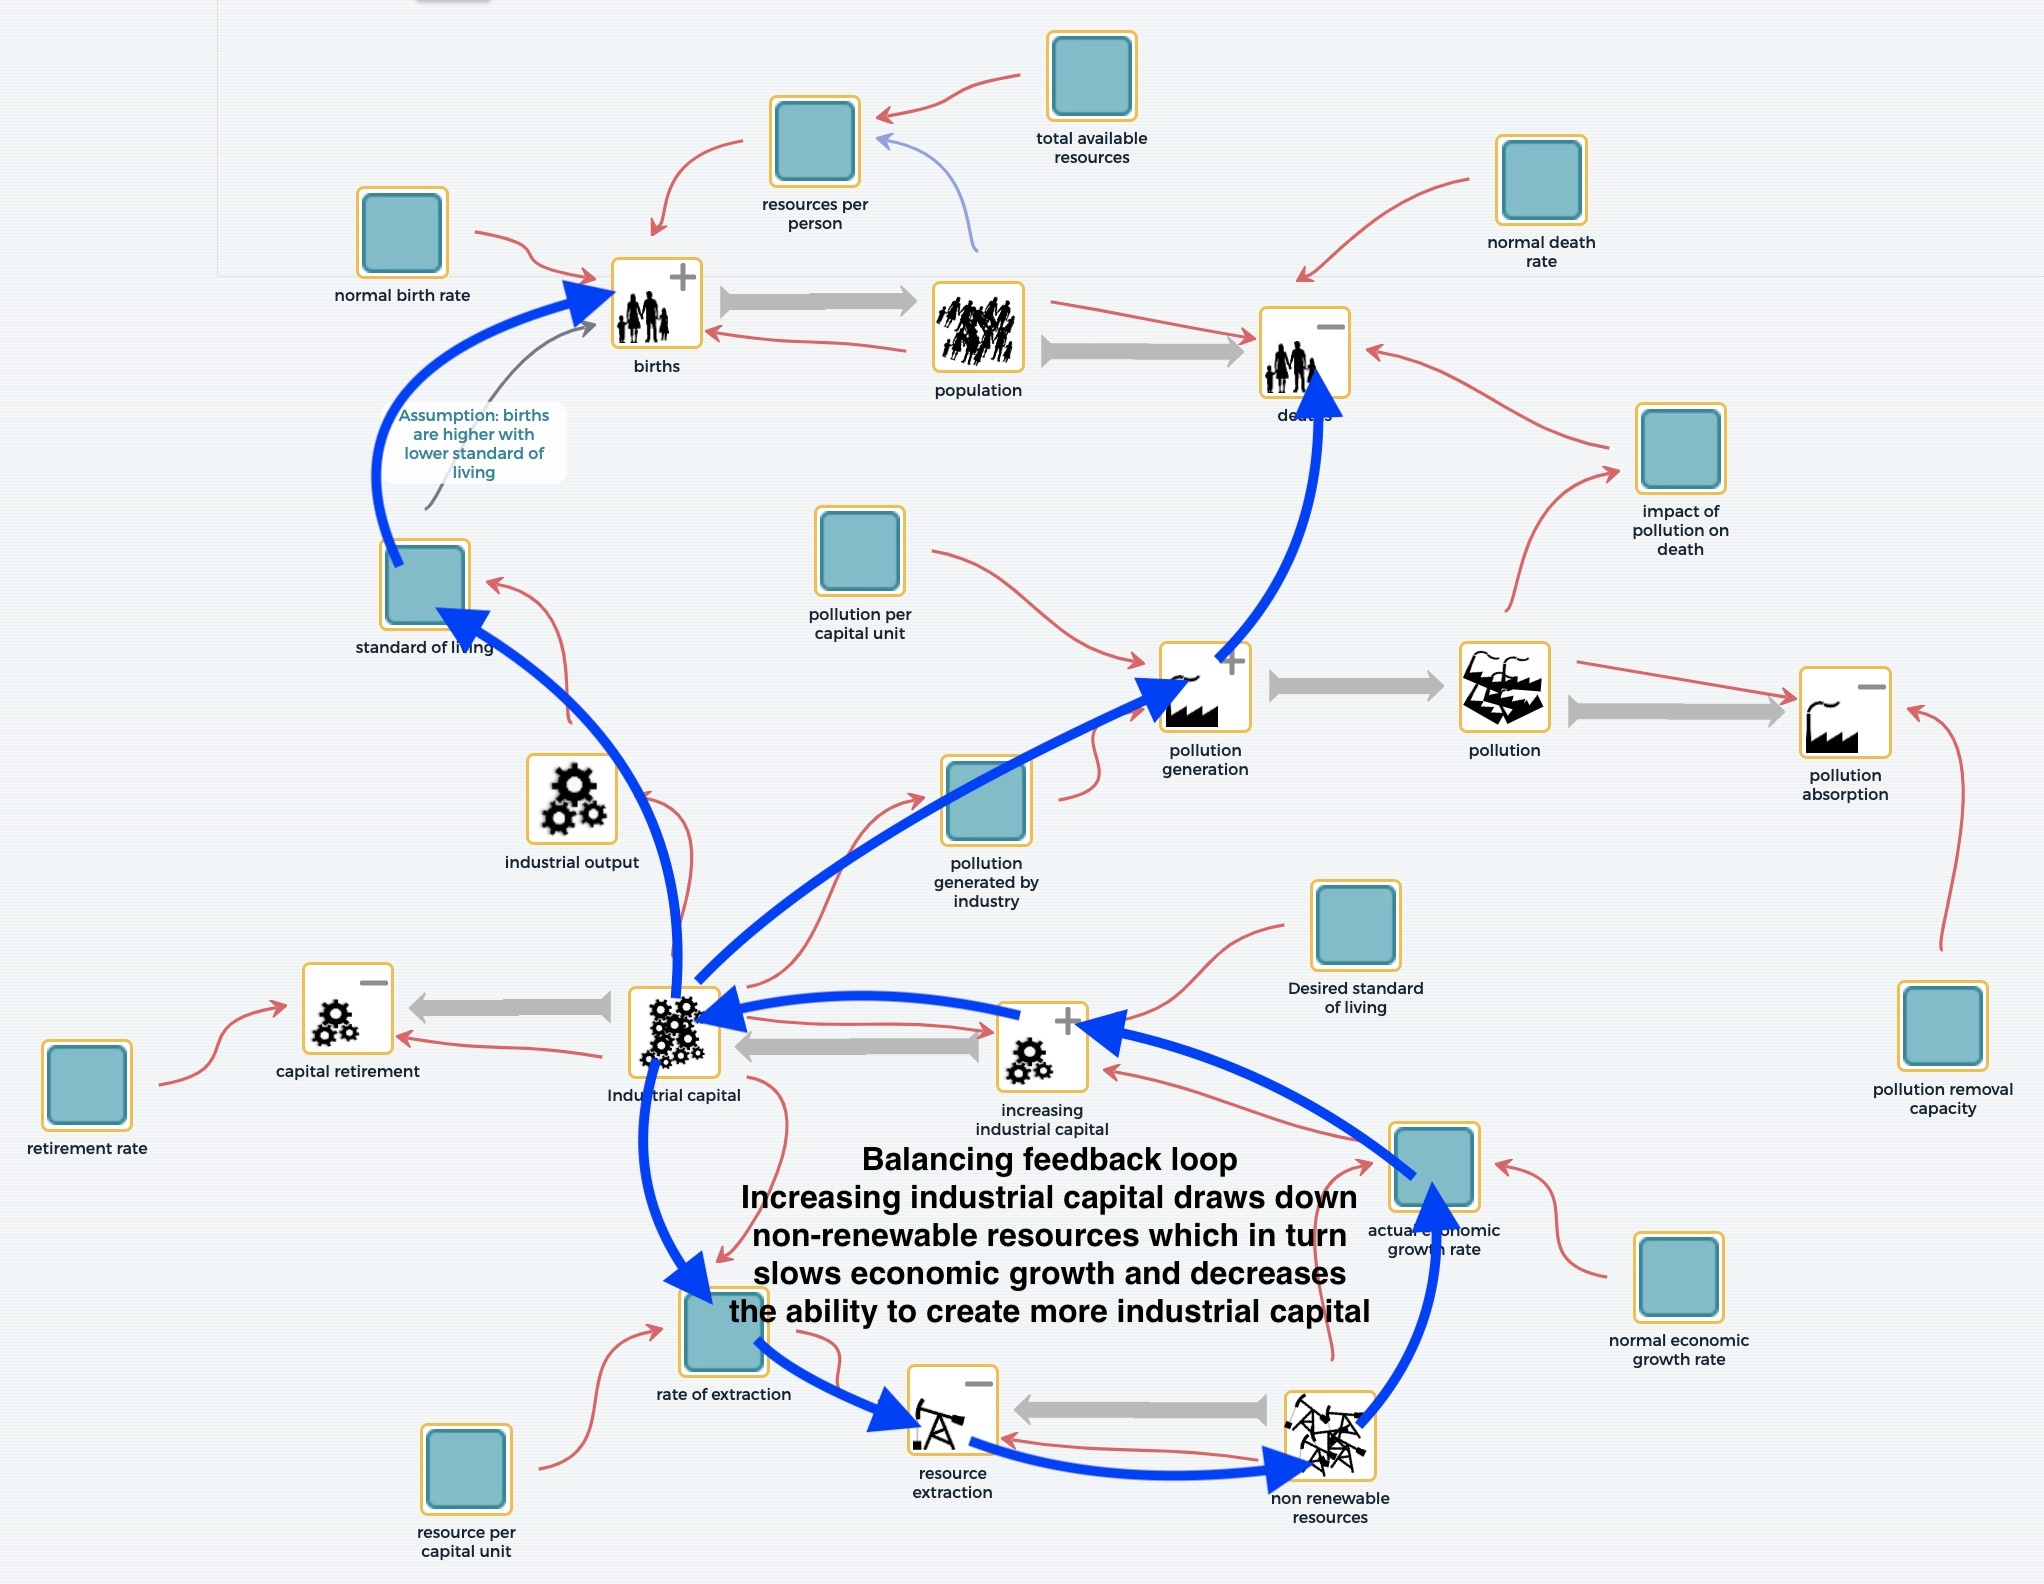
Feedback loop and its impacts highlighted.
The fluctuating behavior of the feedback loop has a significant impact on the rest of the model. The initial growth in industrial capital helps to create a higher standard of living and for a while supports a higher birth rate and growth of the human population. The growth of industrial capital and output also results in increased pollution. As pollution increases, so do human deaths, and though the population continues to grow, it does so at a slower and slower rate until the deaths exceed births and the population begins to decline.
So … did you get all that?
Congratulations, if you did, because there was a lot going on!
Imagining loops, components, and paths of influence, then mentally simulating them through time is not something that human brains do well. We tend to think one step at a time, sequentially and very methodically. When systems get large with many components and complicated and interlocking circular pathways, it’s impossible to mentally simulate the system because we humans don’t have the capacity to imagine it all happening at once.
In this example, we added huge complexity to the system’s behavior by connecting a few simple models together. Imagine an even bigger system with more interacting loops.
This is where computer models shine!
- Computers can address complexity “all at once” as opposed to the linear approach used by the human brain, and thus alert us to unanticipated and nonintuitive behaviors that might arise.
- Computer models provide a “workbench” upon which experimental decisions can be made and simulations run, to see their potential impact well into the future.
- Playing with computer models can help build our intuition about feedback and focus our attention on the importance of our own decisions, rather than automatically blaming external factors as the reason for our experience.
Most importantly, from an educational point of view, taking the time to build a computer model requires that we gain an intimacy with the system under study that cannot be achieved without the ability to consider, define, and test the causal connections among its components.
Perhaps one day our students will use the ideas of system dynamics and SageModeler to help humanity make more informed decisions and avoid the outcomes originally modeled in The Limits to Growth. Let’s hope so.