In the WeatherX project, a collaboration involving EDC, Mount Washington Observatory, the University of Washington, and the Concord Consortium, we engage middle school students with weather data and weather science. We concentrate on extreme weather, of which there is plenty on Mount Washington. But, of course, every part of the world experiences extreme weather at times, especially as global warming adds ever more energy to our oceans and atmosphere.
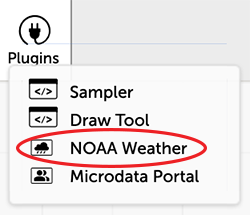
To help students, teachers, and project staff investigate weather data local to them, we developed the NOAA Weather plugin for CODAP. With this plugin, users can access hourly, daily, or monthly weather data from over 1,700 U.S. weather stations. The majority of stations provide nearly up-to-the-minute data and often have historical data extending back to the mid-twentieth century.
Here, I invite you to follow along with my two recent searches—for extreme rainstorms and extreme heat—using the NOAA Weather plugin (Figure 1). But first, a quick note about terminology. NOAA defines an extreme event “as a time and place in which weather, climate, or environmental conditions—such as temperature, precipitation, drought, or flooding—rank above a threshold value near the upper or lower ends of the range of historical measurements.” This means we’ll be looking for outliers in the data.
To begin my searches, I first had to decide on locations of interest to me. Since I lived in Pittsburgh, Pennsylvania, for several years when I was in grade school, I wanted to investigate the weather there. I was also interested in Topeka, Kansas. Though I was born in Brooklyn, I spent the first year of my life in Topeka where my mother waited for my father to come back from Japan just after WWII ended.
So, off to Pittsburgh and Topeka we go.
My goal is to show that it’s possible to find extreme weather by following these five steps:
- Choose a weather observation station with good historical data
- Get monthly data from that location
- Plot temperature or precipitation over time
- Identify outliers in the data
- Do a web search for that location and month/year with a key word like “storm” or “heat”
Destination Pittsburgh: Searching for extreme rainstorms
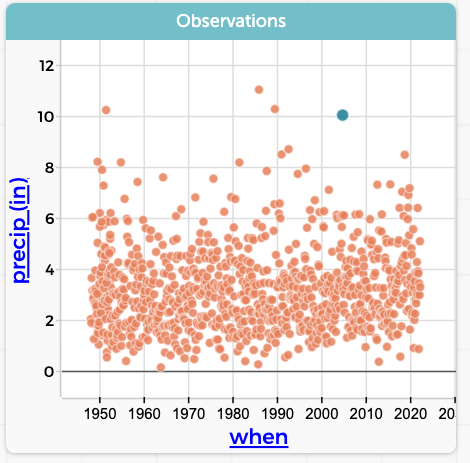
Pittsburgh has an international airport weather station with data going back to 1945. First step done! I searched Pittsburgh data dating from January 1949 using the NOAA Weather plugin.
Next, I made a graph of precipitation over time and looked for outliers. There are four months with over 10 inches of rain, the most recent in 2004. The blue dot highlighted in the graph in Figure 2 is one such outlier.
Then, with a quick web search, I was able to locate an interesting series of photos of the flooding (Figure 3). According to the newspaper article, the flooding would likely have been catastrophic had it not been for flood control measures put in place after a flood on St. Patrick’s Day in 1936. Yikes!
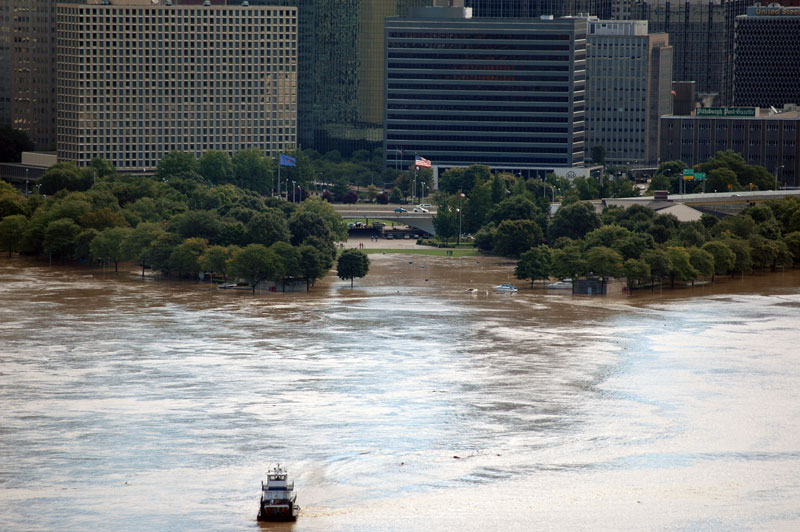
https://www.brooklineconnection.com/history/Facts/Flood2004.html
Photo credit: Justin Lauck
My data exploration was fun and made me appreciate flood control and its beneficial (and harmful) effects.
I’ve documented the steps above in the CODAP document “Searching for storms” using another CODAP plugin called Story Builder, which allows me to embed my data investigation story directly in CODAP with five “moments” or tiles and accompanying data, tables, graphs, images, and web links. Please click on the above link to see how nicely this works and to compare that experience with the one you have just had by reading about it.
Destination Topeka: Searching for extreme heat
Now for my experience searching for an extreme heat event!
I followed the same steps, but the experience was quite different. You can follow along with “Searching for extreme heat.” The Story Builder at the top of the CODAP document has five numbered tiles representing separate moments during which I recorded data displays and my reflections on the data. As you click through each numbered tile, you’ll see that I was able to find an extreme heat event in Topeka. Though it didn’t jump out of the data like the Pittsburgh storm did, the Topeka extreme weather event was part of a very widespread heat wave that set temperature records.
I hope that you enjoyed these two short extreme weather data stories as much as I did. Please try your own hand at finding weather extremes. Start with the NOAA Weather plugin or make a copy of one of the two CODAP documents shared here and edit them to suit your own search.
I’d love to hear from you about how it went and, if you’re a teacher, whether you might try it with students!