If one of your New Year’s resolutions is to add more data exploration to your lessons this year, we have a week’s worth of activities to get you started. Because data is interdisciplinary, you can find a home for it in any scientific discipline from astronomy to zoology, and across the halls in humanities, social studies, economics, and more.
Monday
Two short tutorials with user-friendly videos and a checklist of your progress will introduce you to our Common Online Data Analysis Platform (CODAP) in minutes. CODAP is an easy-to-use web-based software that makes it possible for students in upper elementary through college to visualize, analyze, and ultimately learn from data.
- Launch CODAP.
- Click the button to OPEN DOCUMENT OR BROWSE EXAMPLES. Select Getting Started with CODAP, then OPEN. Follow the prompts.
- Once you’ve mastered your first set of data moves there, navigate to the file menu within CODAP, choose Open, click YES on the dialogue box, then select Getting Started with CODAP 2.
Whether the source of data is a game, a map, an experiment, or a simulation, CODAP provides an immersive, exploratory experience with dynamically linked data representations, including graphs, maps, and tables.
Tuesday
Everyone has a birthday! Celebrate yours with a data lesson. This guided activity is perfect for anyone whose birthday falls between 2003 and 2014 (middle school students through undergrads). Make a copy of the Google Doc and share it with your students. Look for distributions, popular birthdays, and more.
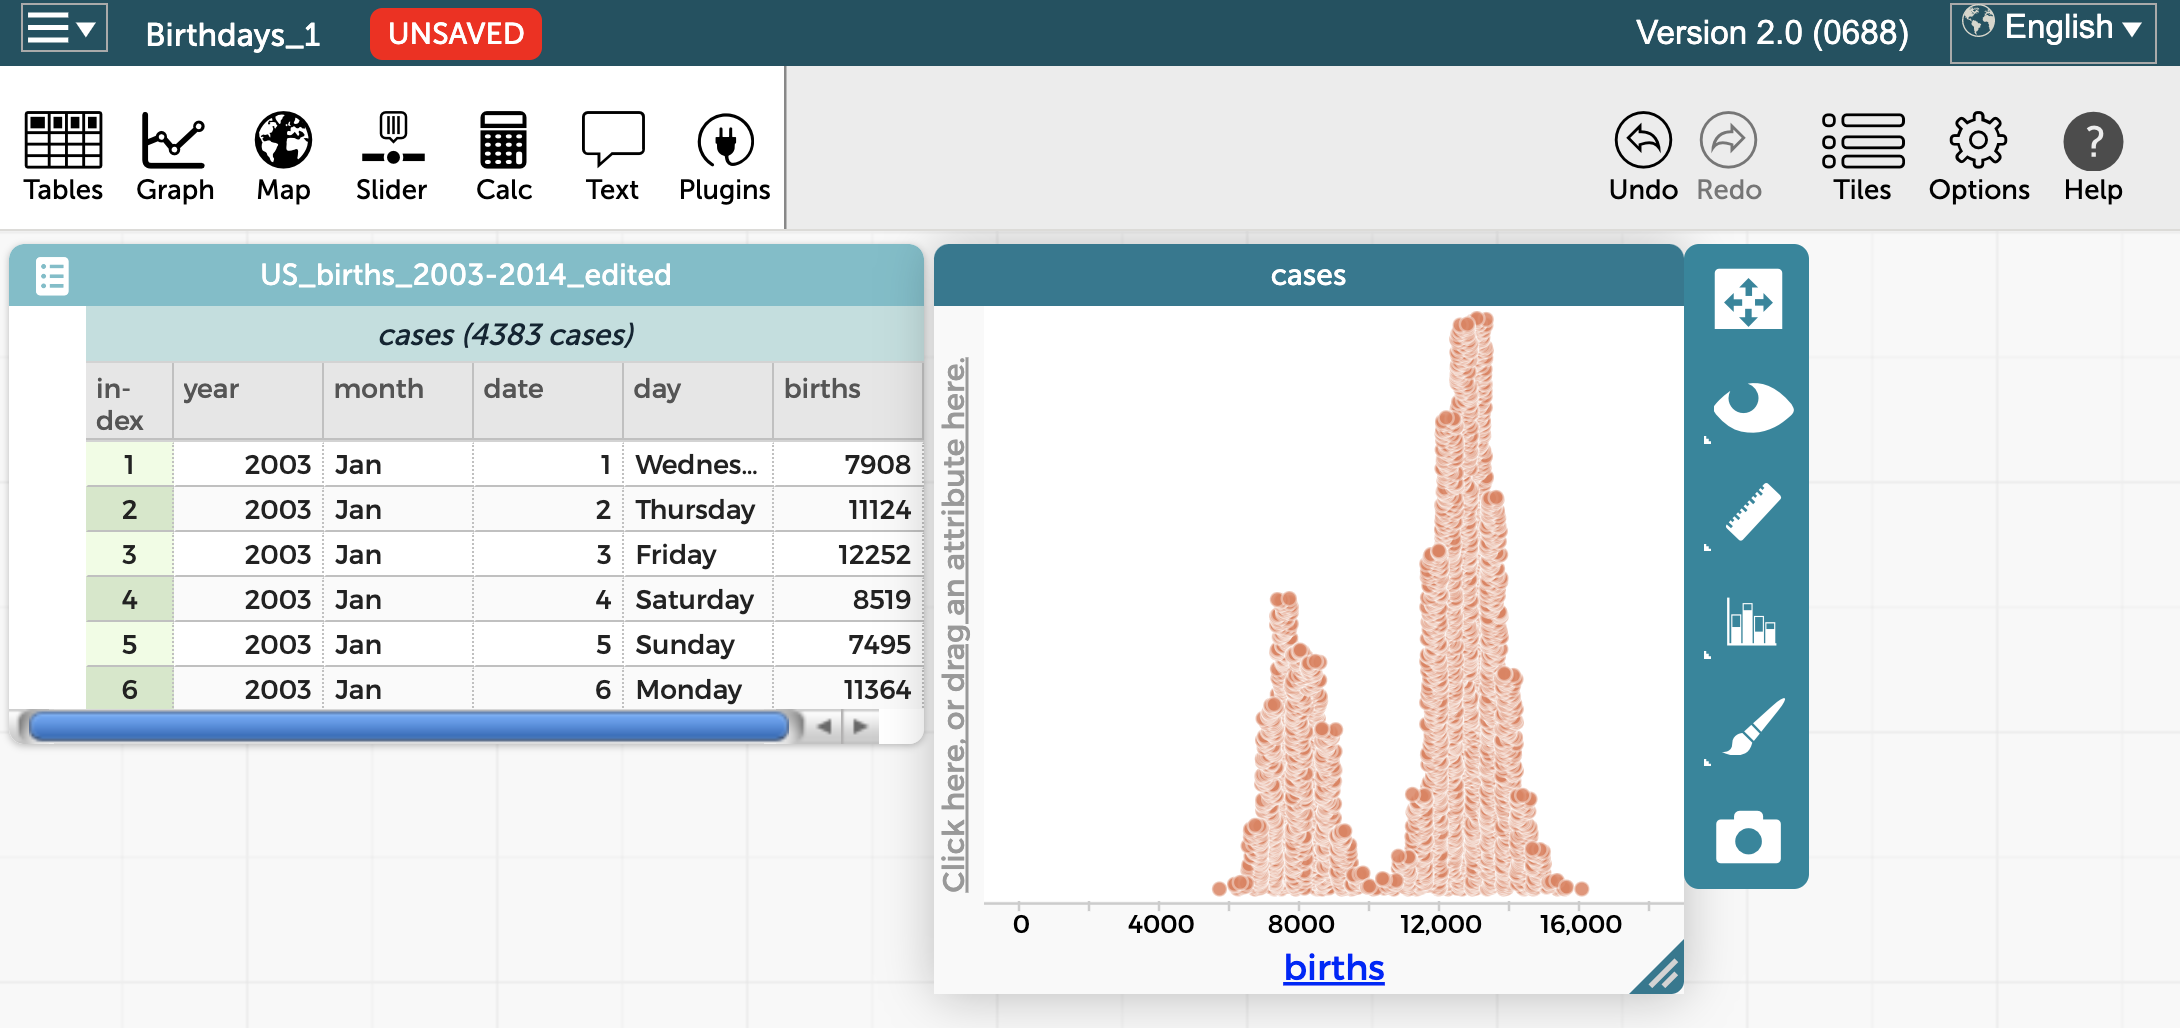
Explore a graph of birthdays in CODAP.
Wednesday
Search for evidence of extreme precipitation at a location of your choice using CODAP’s NOAA Weather plugin. Answer the question: When it rains, does it always pour? (Note: This activity is called a “Monday’s Lesson” in our @Concord newsletter, but we saved it for hump day for you this week.)
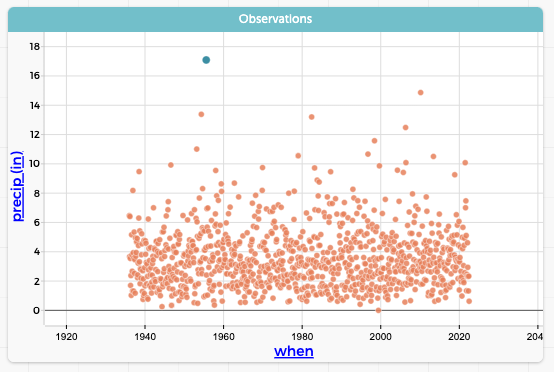
Monthly accumulated precipitation (inches) in Boston for the last century.
Bonus: Learn about other CODAP plugins built into CODAP.
Thursday
If you’re a fan of The New York Times “What is going on in this graph?” series, then you’re sure to enjoy a similar set of activities called Data Story Bytes. Available as Google Slides for students in grades 6-12 in different subject areas (e.g., science, social studies, health, math, English, business), they include directions in both English and Spanish for short lessons (30 minutes or less). Data Story Bytes use a four-part questioning framework to help students make sense of data, build personal connections, reflect on the context and history of the data, and envision future uses of data.
Friday
Interested in investigating social justice issues in the U.S.? The Investigating U.S. Society with Data (USS-DATA) curriculum modules promote high school students’ statistical thinking and data literacy skills. Two modules that include 15 ready-to-teach full-period lessons investigating income inequality and immigration are currently available.
No matter what subject or grade level you teach, we hope you’ll add more data explorations to your class this year. Let us know what types of additional data science activities you’d like by completing this short survey.