We experience weather every day. And it’s often the easiest icebreaker to start a conversation—“What’s the weather like in your neck of the woods?”—since weather is, well, everywhere! We know a lot about weather, too, thanks to datasets collected by the National Oceanic and Atmospheric Administration (NOAA).
The NOAA database includes data from thousands of weather stations located all over the United States. Many of these weather stations have data that goes back to the 19th century, and many more have data that is current. And you can choose to look at weather records by the hour, day, or month.
In collaboration with the WeatherX project at EDC, we recently incorporated access to that vast database through a plugin in CODAP, our Common Online Data Analysis Platform. (And in the past month, a few updates to CODAP—including search by location, hourly observations in addition to daily and monthly, and much better feedback about the progress of your request for data—have made it even more exciting and easy to use!) You can now explore historical and current weather data from around the U.S.
To pique student interest, try the following questions, or come up with your own—for your own neck of the woods.
- On average, do you think it’s colder or warmer in San Francisco (on the ocean) or Concord, California (about 30 miles east)? In May? In December?
- On average, do you think it’s colder or warmer in Boston (on the ocean) or Concord, Massachusetts (about 30 miles west)? In May? In December?
(With our offices in both Concord, MA, and Emeryville, CA, located quite close to San Francisco, these questions are of special interest to us.)
- Over what time spans can you start to see changes in temperature that reflect our changing climate?
Explore your weather questions
- Open CODAP and create a new document, then click the Plugins menu in the top bar and select NOAA Weather.
- Choose a weather station by clicking on the map or by searching for a weather station near a particular geographical location (e.g., Concord, MA).
- Set a date range of interest and the frequency of data (monthly, daily, or hourly). Now click Get Data. The plugin portal makes its request from NOAA and brings the data into CODAP in a table.
- Make a graph by dragging an attribute from the table to the x or y axis. (Learn more about making graphs.)
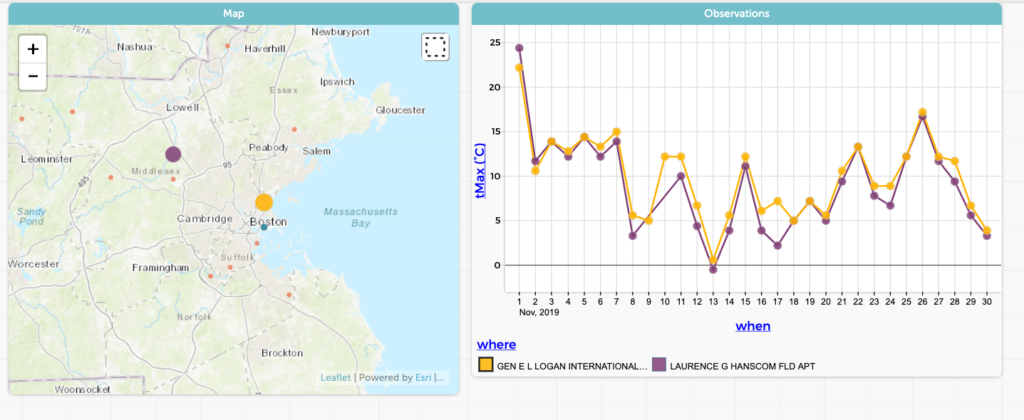
Weather data for the month of November 2019 in Boston, MA, (yellow) and Concord, MA, (purple) displayed in CODAP.