Category: About Us
The Concord Consortium is a 501(c)(3) nonprofit charity registered in the U.S. under EIN 04-3254131. Our financial statements are a record of our achievements. Audited financial statements FY 2024 Audited Financial Statements FY 2023 Audited Financial Statements FY 2022 Audited Financial Statements Form 990 FY 2024 Form 990 FY 2023 Form 990 FY 2022 Form […]
Every gift matters. The Concord Consortium is a 501(c)(3) nonprofit educational research and development organization dedicated to advancing STEM inquiry through technology to equip learners and empower lives. Your donation fuels groundbreaking innovations in STEM education and technology and empowers teachers and students across the globe. Donations can be made by credit card, PayPal, Venmo, […]
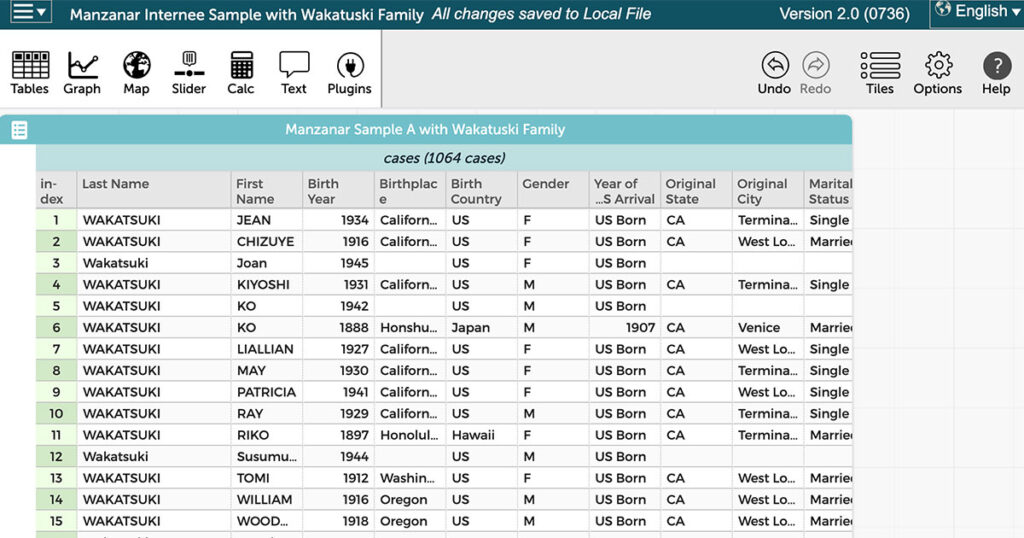
Middle school social studies students typically study 20th century immigration, including the push and pull factors that guided immigration and the policies that shaped travel to (and from) the United States. Additionally, Jeanne Wakatsuki Houston’s memoir Farewell to Manzanar, which details her experience in a Japanese American internment camp during World War II, is a […]
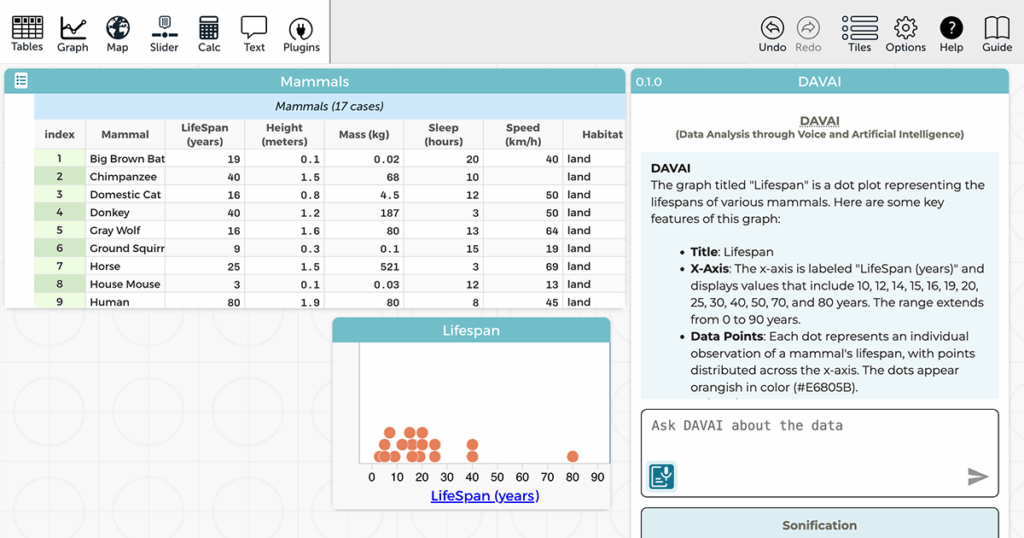
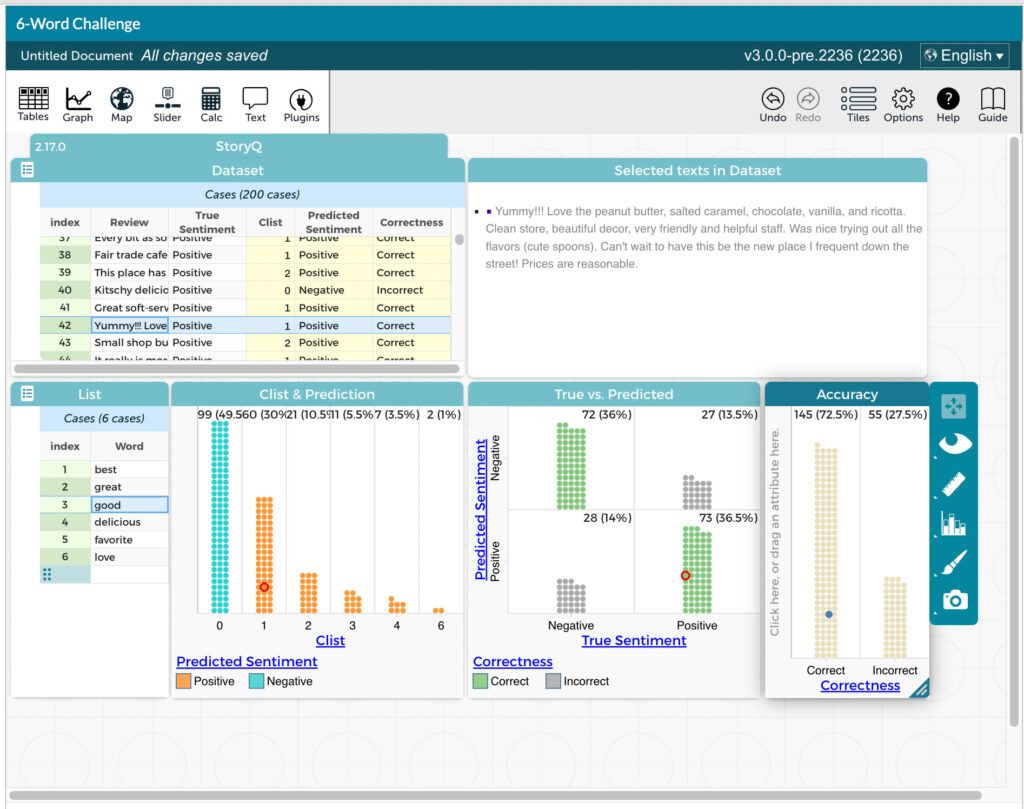
Our Common Online Data Analysis Platform (CODAP) engages learners in data science practices, including data analysis and visualization. But what does “visualization” mean to blind or low-vision (BLV) learners? A new National Science Foundation-funded project is using artificial intelligence (AI) to develop and research new tools for making data exploration accessible to BLV learners. Graphs—and […]
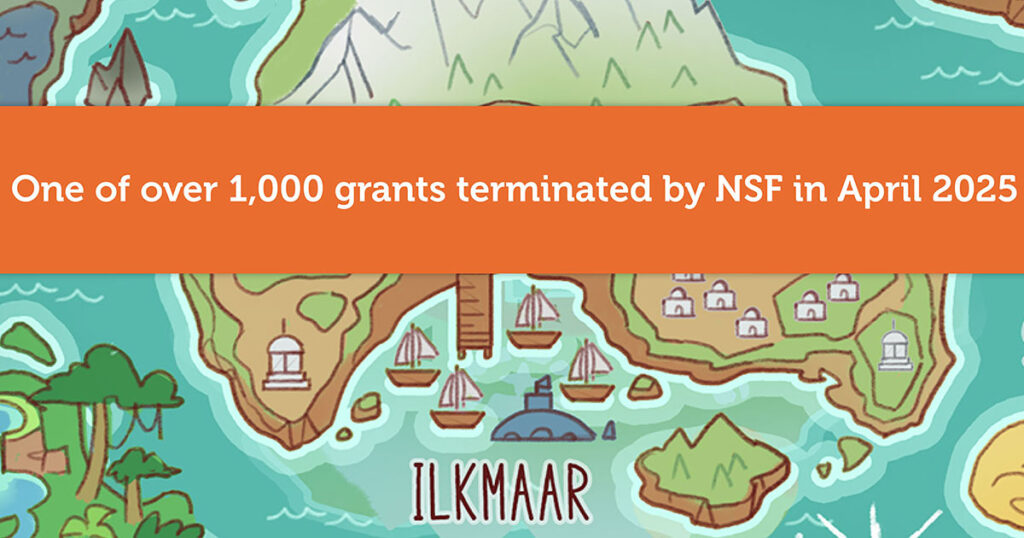
For many nonprofit organizations and institutions of higher education, recent Fridays have been overshadowed by a sense of dread. For four successive Fridays—April 18, April 25, May 2, and May 9—over 1,400 National Science Foundation (NSF) awards were abruptly terminated in enormous weekly batches. (There were a few letters of termination on other days of […]
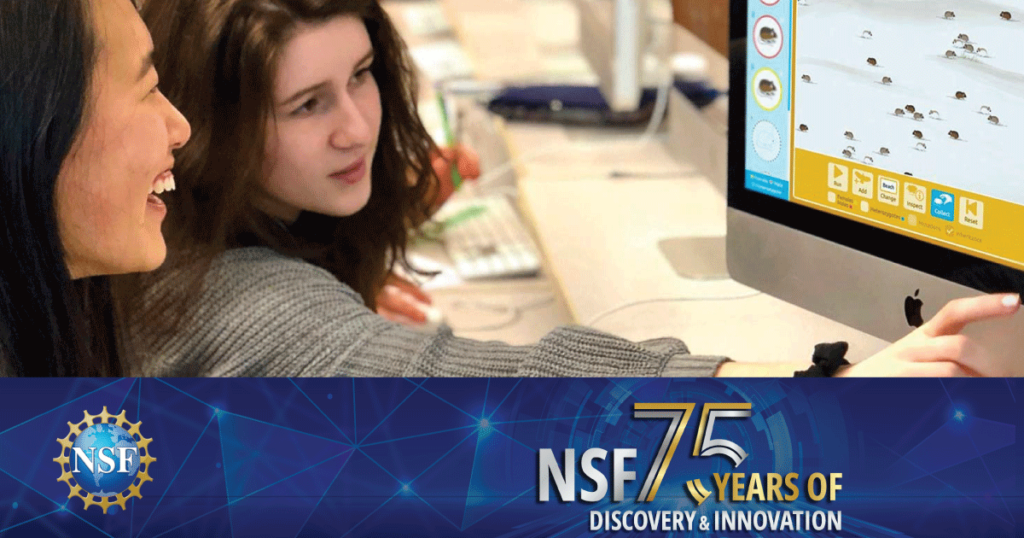
On May 10, 2025, the National Science Foundation (NSF) celebrates 75 years of empowering discovery, innovation, and learning. For generations, NSF has supported the ideas and people that have shaped STEM education, research, and opportunity in America. But this milestone is more than a celebration—it’s also a moment for reflection. The gains we’ve made through […]
What does learning about artificial intelligence have to do with learning math? A group of enthusiastic middle and high school students are finding out, thanks to a new supplemental program offered this spring at the Florida Virtual School! As an extension of their Algebra 1 course, students are learning to build an AI model that […]
Tracking progress and giving thoughtful feedback to a classroom of 20 or 30 students in real time as they move through online curriculum can foil even the most heroic of teachers. Teachers are left wondering where their students are in an activity and if they are producing quality work. Our Class Dashboard—included in most of […]
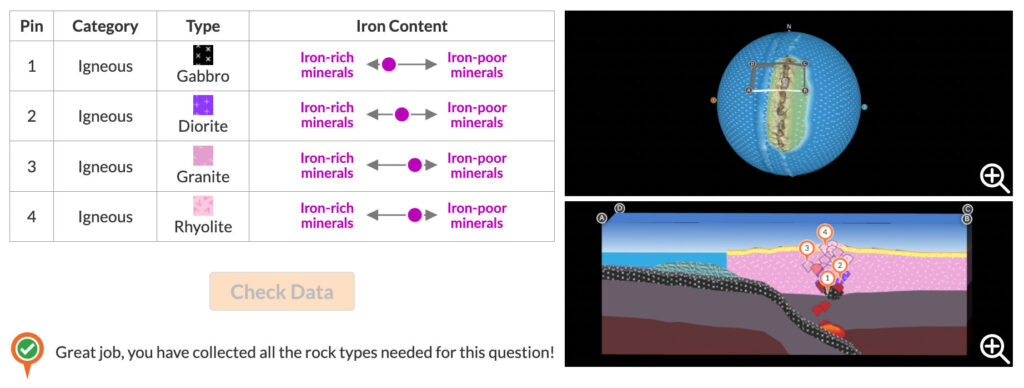
We’re thrilled to announce an updated release of the Rocks & Tectonics module! This module revolutionizes the teaching of the traditional rock cycle by connecting rock formation to plate motion and the tectonic conditions under which rocks form. The new version of the Rocks & Tectonics module incorporates new interactive feedback mechanisms designed to support […]
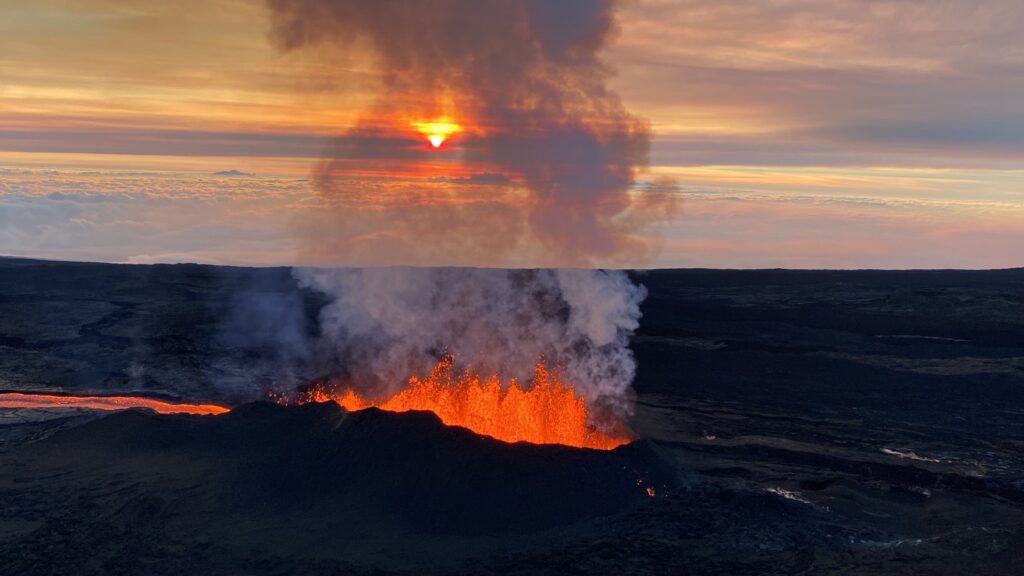
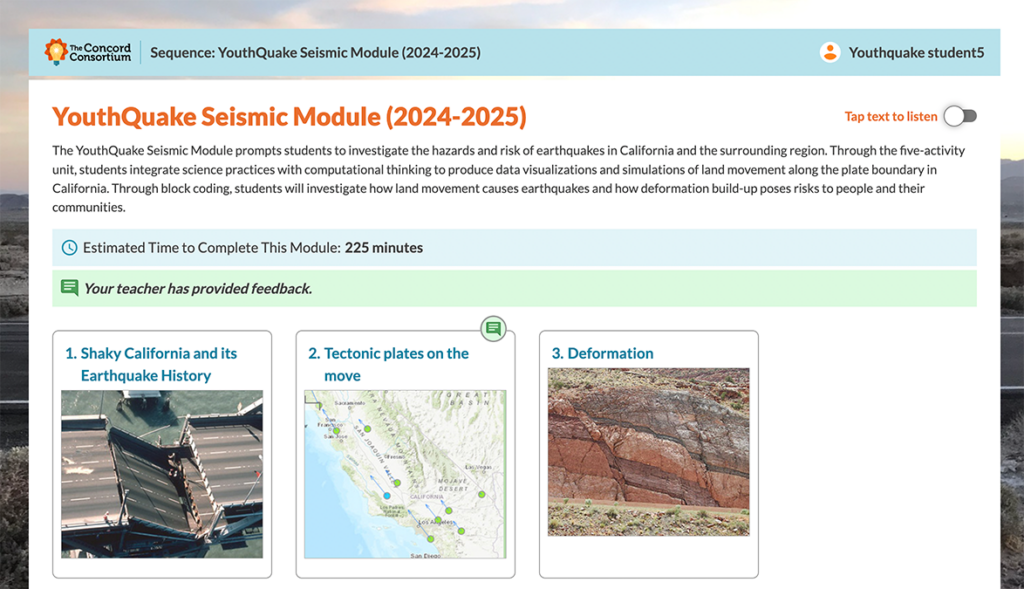
Hawaiʻi’s iconic volcanoes have shaped its islands, culture, and communities for centuries. From the breathtaking eruptions of Mauna Loa to the challenges of living with air pollution caused by the eruptions (known as “vog”), volcanic activity is an intrinsic part of life in Hawaiʻi. What if students could harness computational tools to better understand volcanic […]