Symbols, objects, maps, graphs, and simulations are all powerful tools for conveying information. However, some complex ideas just can’t be captured in a single representation. In these cases, multiple visualizations can be used together to convey and connect several pieces of related information.
For example, during the COVID-19 pandemic, news organizations used a combination of maps, graphs, and data tables to communicate the number of infections, places with the highest infection rates, and how the infection rate changed over time to inform the public about the potential risk level for getting sick. Increasingly, multiple linked visual representations are being used together to develop, clarify, and communicate complex ideas.
To help students effectively use multiple representations for science learning, we need to build students’ representational competencies, or the knowledge and skills that enable students to use representations to reason and solve scientific questions. Our National Science Foundation-funded GeoCode project did just that. We created a block-based computational tool called the GeoCoder that allows students to build code, manipulate simulations, and visualize data to help them understand the environmental factors that influence earthquake occurrence and severity. We embedded the GeoCoder in an online curriculum module that scaffolds secondary students as they manipulate the representations to investigate the earthquake cycle.
The earthquake cycle is the process of land deformation building up over time along a fault line and eventually being released in a sudden, sometimes catastrophic, event. This abrupt release of deformation is an earthquake. While the study of earthquakes is part of every Earth science curriculum, students rarely have the opportunity to take a deep dive into the cause of earthquakes or investigate the repeated occurrence of earthquakes in certain locations by using dynamically linked representations to change parameters.
In the spring of 2023, 7 teachers and their 431 students participated in a field test of the inquiry-based “Assessing Seismic Hazards and Risk with Code” module. A new paper focused on the insights gained from this field test was recently published in the journal Computers & Education. This blog post summarizes the methods and key findings of that study.
Multiple, dynamically linked representations
The GeoCoder includes three representations to help students develop their knowledge of the earthquake cycle. A procedural representation displays block codes, a geometric representation shows land deformation build-up, and a graphical representation shows deformation build-up over time (Figure 1).
Figure 1. 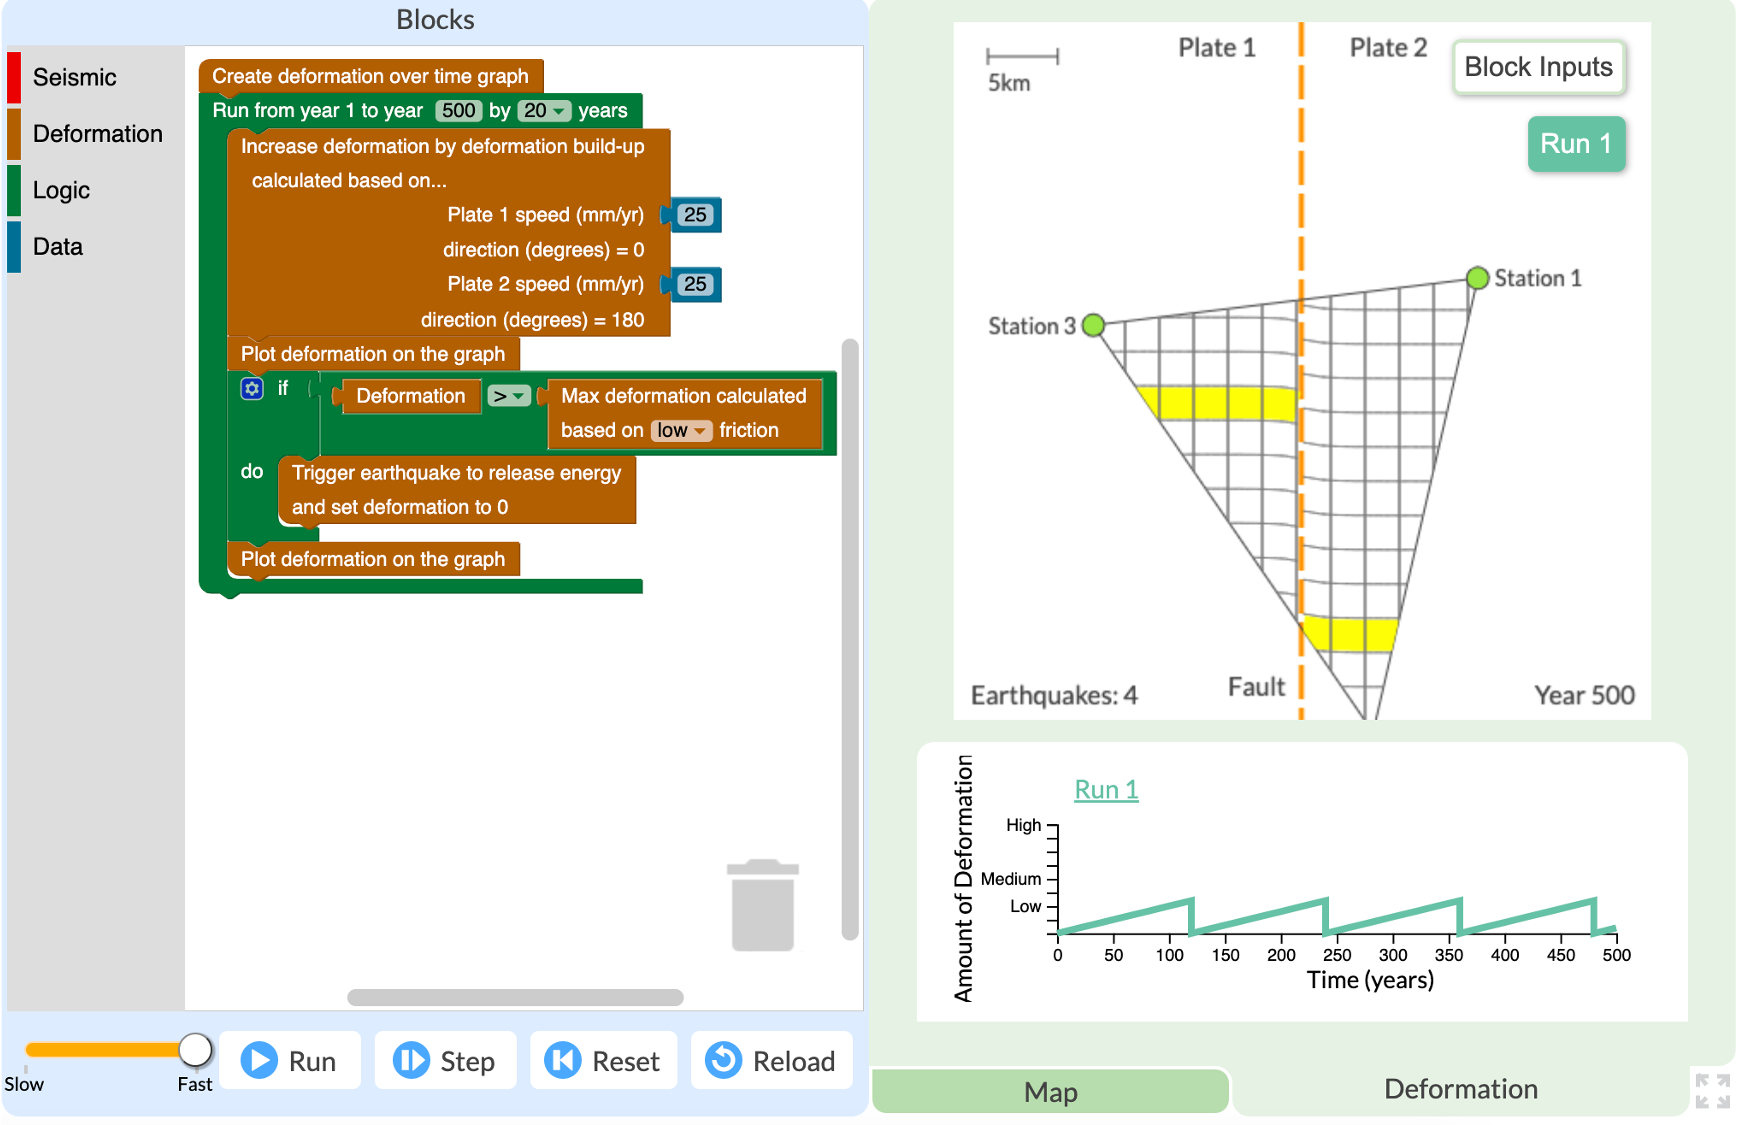
Figure 1. The GeoCoder model displays block code (procedural representation, left), the Deformation Simulation (geometric representation, upper right), and the deformation over time graph (graphical representation, bottom right).
We refer to the block code as a “procedural representation” because the order and syntax of the blocks describe the actions and events that take place as the GeoCoder runs. Each block is highlighted as it is executed, helping students to make connections between the execution of the code and the outputs in the other representations.
The geometric representation is a simulation we call the Deformation Simulation. It is a mathematical calculation of plates sliding past each other shown as movement in a grid. The simulation is a bird’s eye view of land around a fault. As one plate moves north and the other moves south, students can visualize how deformation builds up over time and eventually releases as an earthquake.
The third GeoCoder representation is the graph of deformation over time. Time is displayed on the x-axis and the y-axis shows the amount of deformation with three levels marked: low, medium, and high. As the model runs, the graph automatically updates based on the amount of deformation in the simulation. The line in the graph increases until the deformation exceeds the maximum deformation level set in the code. Then, when an earthquake occurs, the line drops to zero, signifying the complete dissipation of deformation.
These three representations are dynamically linked because actions performed on one representation (the block code) are automatically shown in both other representations (the Deformation Simulation and graph). The three representations together show overlapping information, such as the build-up of deformation over time in the Deformation Simulation and graph. Yet each representation also shows unique information, such as the block code syntax indicating why earthquakes repeatedly occur. The additive value of all three dynamically linked together allows students to build their knowledge of the earthquake cycle in a more robust way than any of the representations individually.
The investigations in the seismic module prompt students to build block code that controls the Deformation Simulation and the graph to understand how differential plate speed and friction level affect the frequency and severity of earthquakes. The activity sequence deliberately scaffolds students through the manipulation of one factor at a time to help them understand the individual effect on the earthquake cycle. For example, on the first page of the activity, students adjust the plate speed of the two plates in the Deformation Simulation to see how the difference in speed affects the rate at which deformation builds up between the plates. On the next page, plate speed is kept constant while students adjust the friction level between the plates between low, medium, and high levels. Finally, on the last page, students look at both the speed and the fault friction of three pairs of actual GPS stations in California to compare the earthquake cycle at each location.
Three essential representational competencies
We identified three representational competencies necessary to carry out earthquake cycle investigations: linking, sensemaking, and conceptualization. Representational linking describes the ability to interpret and translate between different forms of representations. Sensemaking involves learning how to identify domain-relevant concepts in the representations and describe how those features are connected across multiple representations. Conceptualization is the ability to explain domain-relevant concepts using representations. Each competency provides a unique way to classify and analyze students’ uses of and reasoning about representations, along with reasoning difficulties.
Key findings
- A majority of students exhibited at least some form of representational competence. Many students were able to describe the dynamic links between each of the representations in the GeoCoder. Students were able to point out the automatic effect of the code on the geometric and graphical representations and articulate which code blocks caused specific changes in the outputs during the model run. Additionally, some students showed strong sensemaking ability when describing the Deformation Simulation, using geoscience-contextualized words such as “plates,” “north and south,” and “land.”
- All three representational competencies were significantly correlated with students’ conceptual knowledge. Students who showed strong ability in linking, sensemaking, and conceptualizing the representations scored higher on questions at the end of the activity that assessed their earthquake cycle content knowledge. Students who did not score well on the representational competency questions did not do well on these conceptual questions.
- The sequence of the curriculum is important. In this study, we deliberately sequenced the representations and representational competency questions to help students link, make sense of, and conceptualize the representations and the earthquake cycle content. We introduced the representations and the visual cues that connect them in sequenced pages so as not to overwhelm students when first using them. It is our belief from this work that students should learn about the representations before being asked to learn from the representations.
Using multiple representations to learn science
These findings add to the growing body of evidence that developing proficiency in representational competencies is crucial for students to effectively learn scientific concepts across various disciplines. We are continuing to study students’ use of the GeoCoder in our ongoing, NSF-funded YouthQuake project. Want to try it in your classroom? The “Assessing Seismic Hazards and Risk with Code” module is available for free for students and teachers in our STEM Resource Finder and comes with a comprehensive Teacher Edition, Class Dashboard, code cheat sheet, standards alignment, and other resources. If you’d like to learn about opportunities for testing Earth science curriculum, please complete this interest survey. We look forward to working with you!