Category: Research Projects
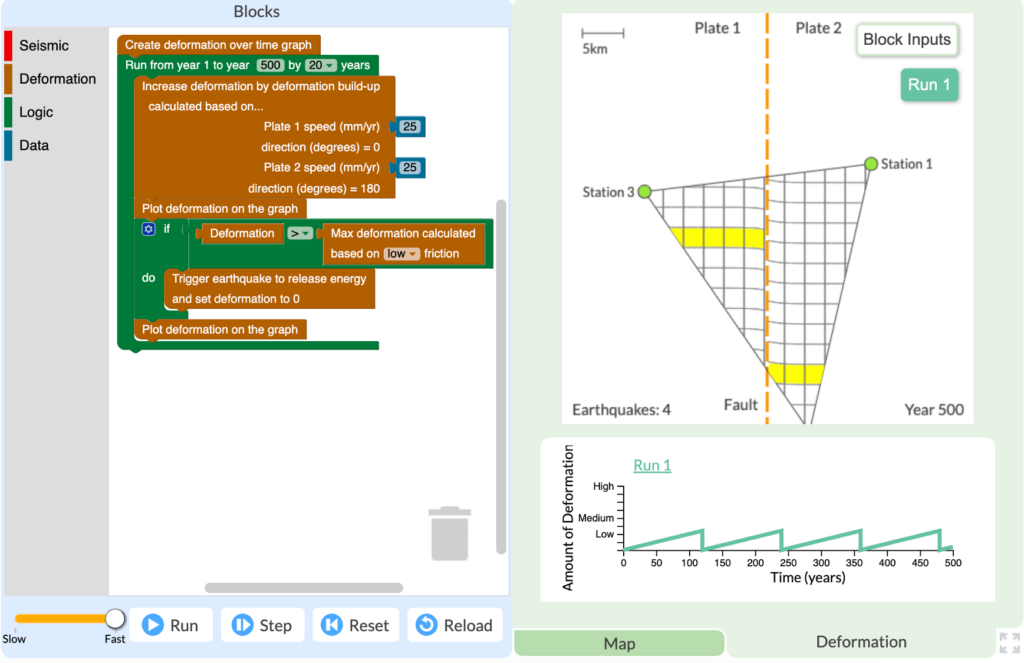
Engaging a research-practice partnership that will bring together oral histories, block coding, and simulations in the development of a locally relevant, culturally enriched curriculum that meets Hawaii’s ambitious computer science education goals.
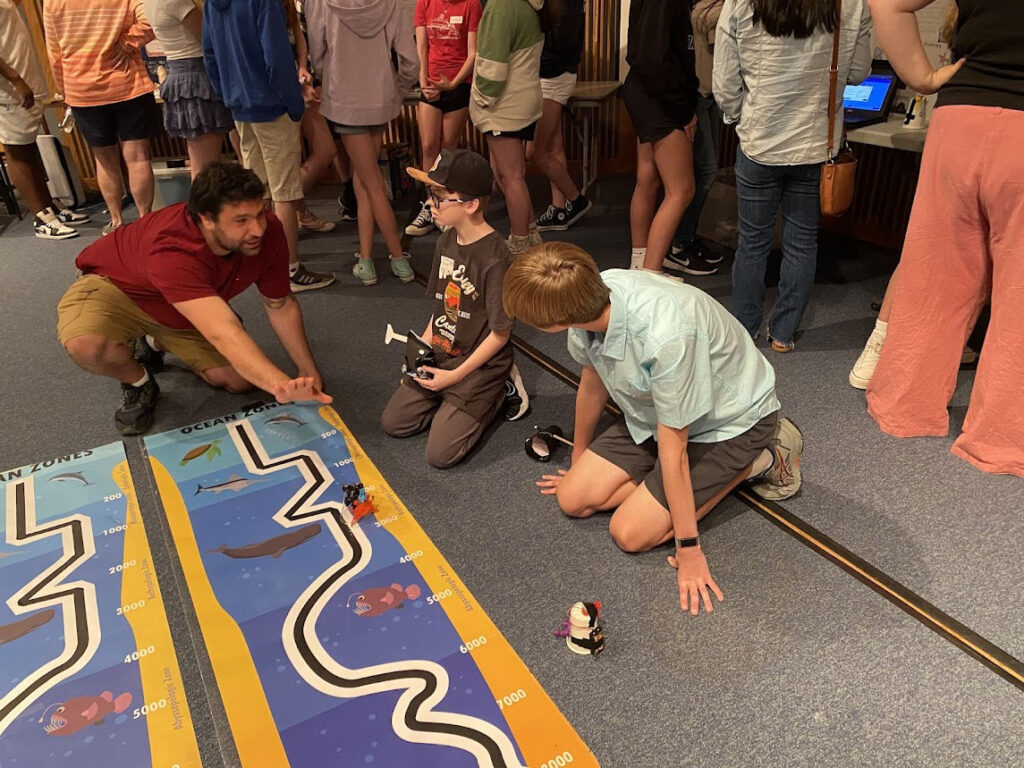
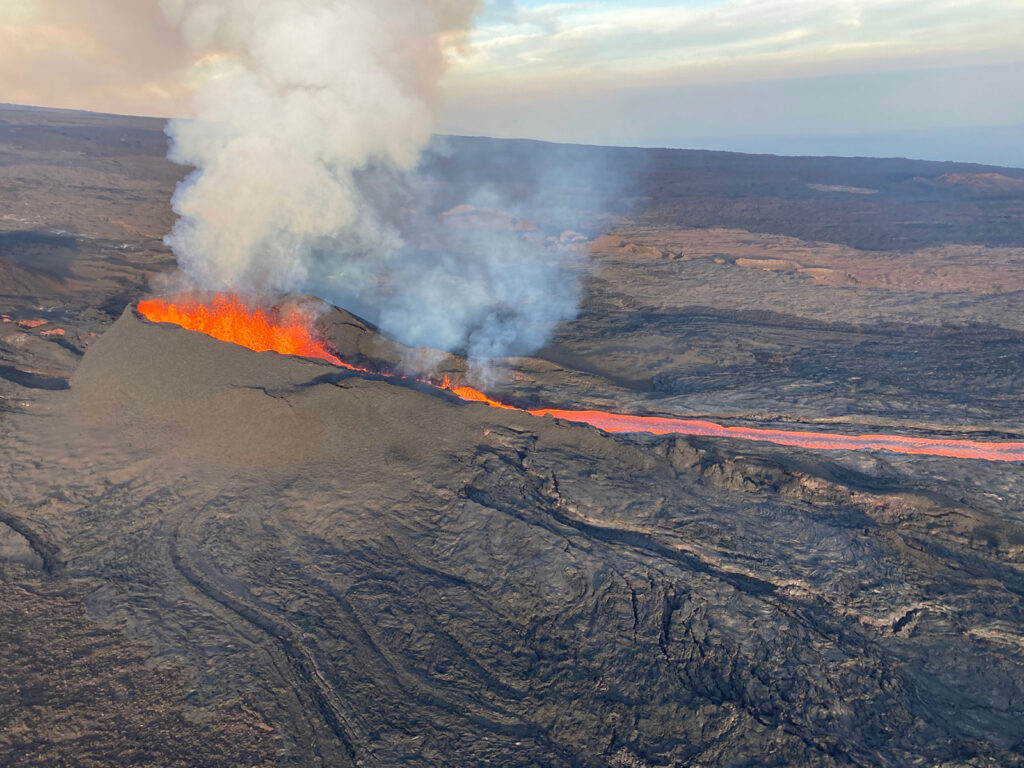
This project is developing three experiential Ocean Twilight Zone learning activities that integrate cutting-edge authentic marine science content with real-world datasets, robotics, coding, engineering design thinking, and collaboration.
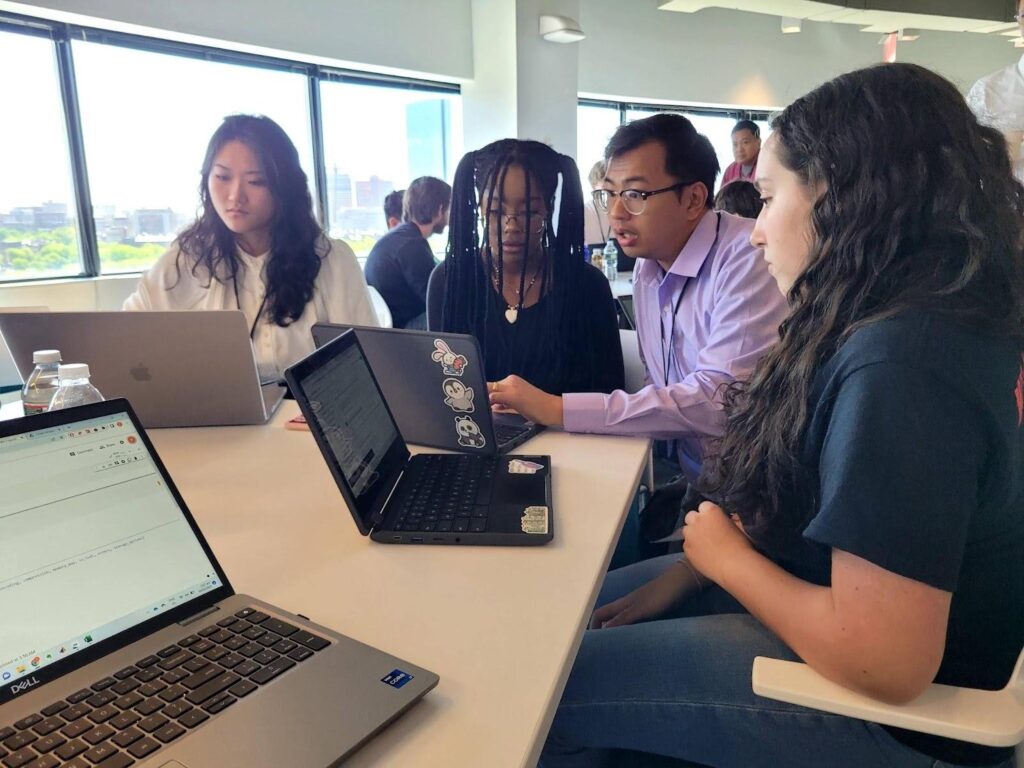
We’re developing an innovative curriculum and datathon aimed at preparing women and minorities to become engineers, researchers, and healthcare professionals who write algorithms, design research methods, and collect data, ultimately reducing bias in AI and medical databases.
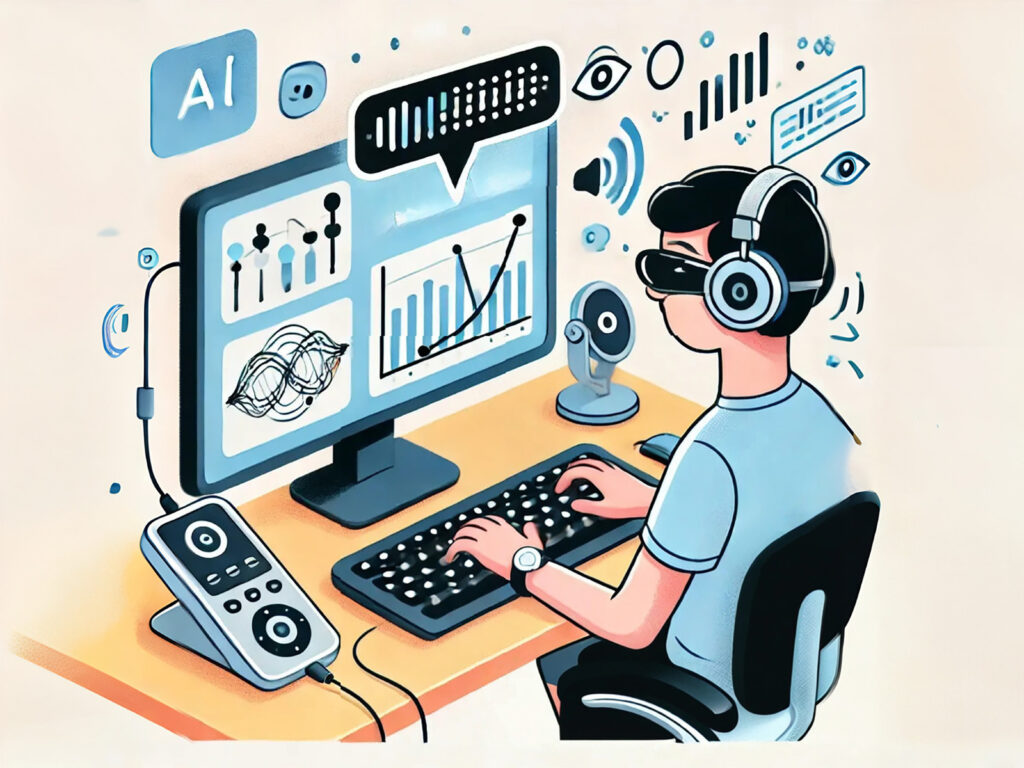
We are addressing the critical need for accessible data science tools in K-12 education by developing a plugin for CODAP that will utilize an AI-powered assistant to facilitate sensemaking with data for blind and low-vision students.

We are working to develop the CODAP ecosystem by engaging user communities, refining development infrastructure, establishing effective governance models, and exploring sustainability options to ensure CODAP’s future.

In collaboration with the University of Florida, Texas Tech University, WestEd, and Florida Virtual School, this project is developing and researching a supplemental program for students to explore AI concepts in connection with their math course.
Symbols, objects, maps, graphs, and simulations are all powerful tools for conveying information. However, some complex ideas just can’t be captured in a single representation. In these cases, multiple visualizations can be used together to convey and connect several pieces of related information. For example, during the COVID-19 pandemic, news organizations used a combination of […]
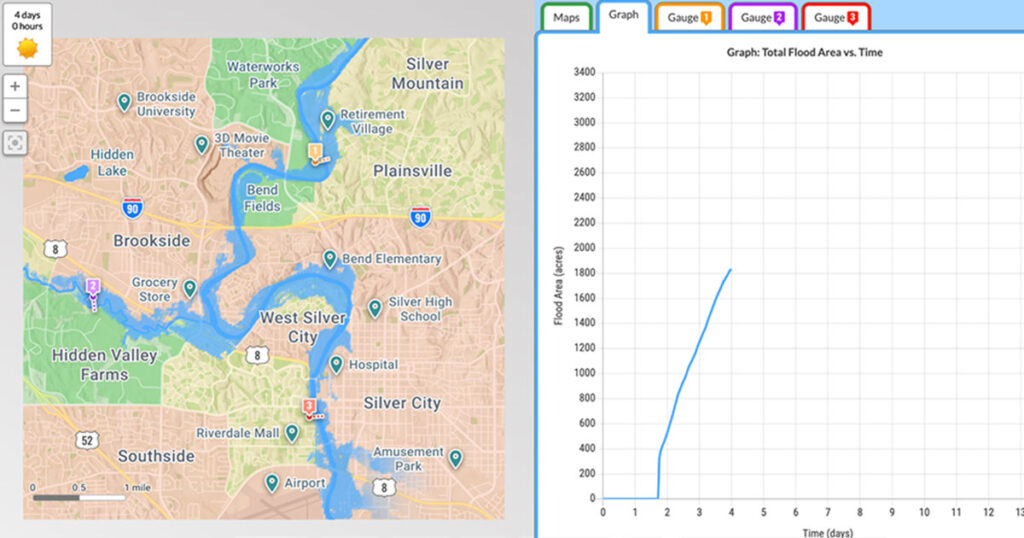
Stephanie Harmon is a Science Consultant with the Partnership Institute for Math and Science Education Reform (PIMSER) in Kentucky. Previously, she taught Earth science and physics at Rockcastle County High School in Mount Vernon, Kentucky, and has consulted on several Concord Consortium projects. For my students in rural Kentucky, floods are personal. In July 2022, […]
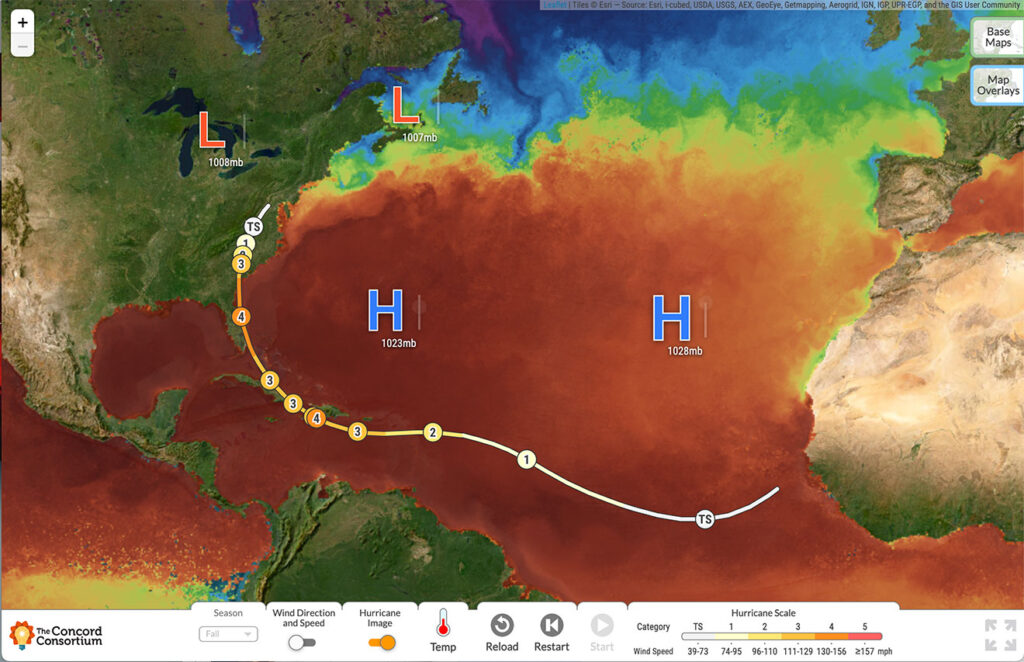
Michael Focht is a middle school teacher in Titusville, Florida, and field tested our GeoHazard modules. Do the names Matthew, Nicole, Ian, or Irma give you pause? Are they long-lost cousins? Friends from high school? For the students in my middle school science classes, these are the names of hurricanes that have impacted them over […]
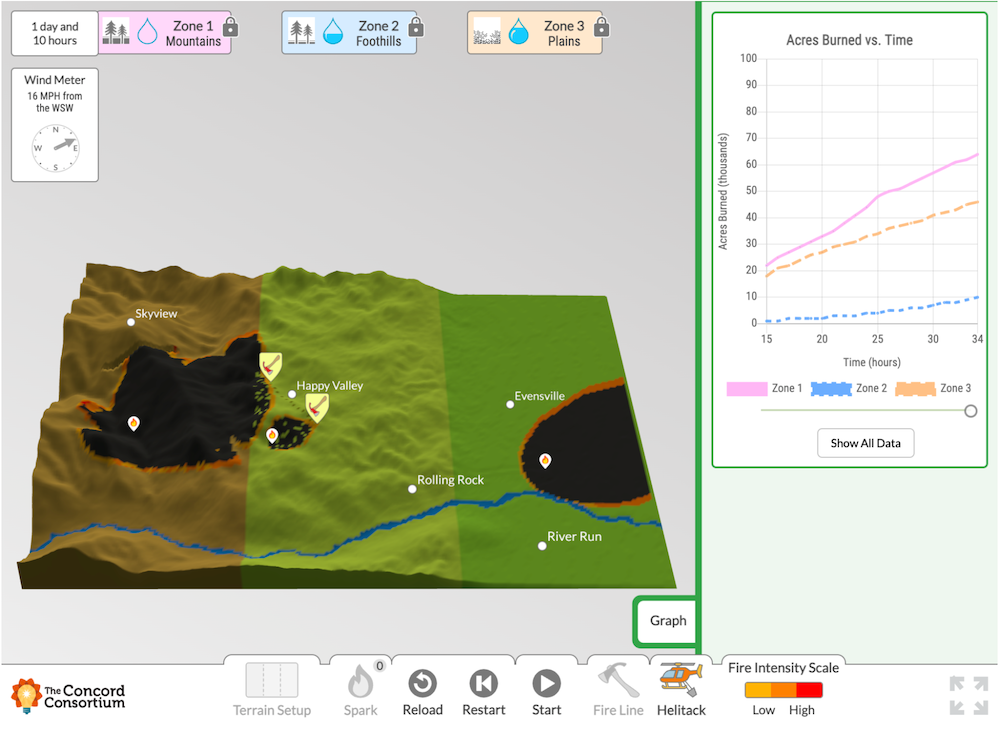
Turn on the news and you’ll see horrific images of flames enveloping hillsides, engulfing homes, and destroying entire communities. This year’s wildfire season is on track, once again, to be one of the worst in history. The number of acres burned in California in August 2024 is already more than double the number of acres […]