Monday’s Lesson: When It Rains, Does It Always Pour?
After months of drought in the Boston area, a sudden rainstorm dumped a large amount of rain in a short time, flooding parking lots and roadways (and one of our basements). The intensity was incredible, but was the weather event itself “extreme”? Climate scientists define extreme as a measurement within the top or bottom 5% or 10% of all records for that date.
1 Get data
Launch CODAP at https://codap.concord.org/ and create a new document.
In this activity, students search for evidence of extreme precipitation at a location they choose using CODAP’s NOAA Weather plugin.
- Choose your weather station. Select NOAA Weather from the Plugins menu. Under “Station Location,” enter your city/state or ZIP code. A drop-down list appears with stations that match your entry. You can also click “Near Me” or use the “Station Map” button to find a station.
- Choose your date range. Select “monthly.” The date range by the name of the station indicates the time frame for which NOAA has weather data. Choose all or part of that range—the longer the time frame you select, the more likely it will find outliers.
- Get data. Click the “Get Data” button. CODAP pulls the data from the NOAA database and creates a table.
2 Analyze data
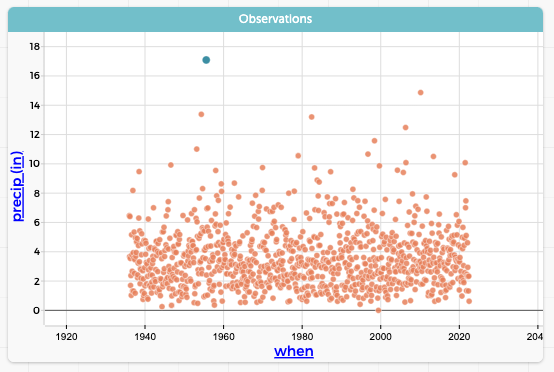
- Create a graph. Click the Graph button. A new graph appears with the data points randomly drawn on the grid. To organize the data, drag “precip (in)” from the table header to the y-axis and “when” to the x-axis (Figure 1). Now that the data is organized to show the amount of precipitation over time, do you see any outliers?
- Analyze graph. Click on a point near the top of the graph for amount of precipitation (e.g., the blue dot in Figure 1). The data associated with that point highlights in the data table. What do you think is going on?

3 Investigate
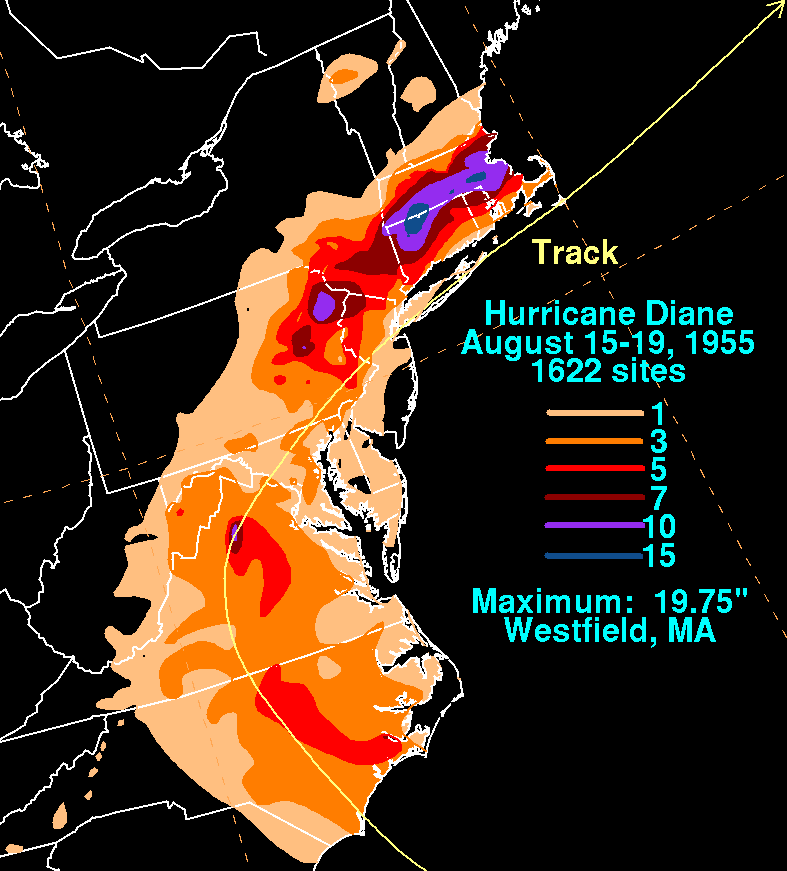
- Do a web search to check the weather on that date (e.g., “August 1955 Boston weather”).
- Read articles that describe the event you found in your data (Figure 2).

https://www.wpc.ncep.noaa.gov/tropical/rain/diane1955filledrainblk.gif
4 Dig deeper
- Examine the hourly data for the day or date range of the weather event. Do other variables give you more information about the weather that happened that day? What patterns do you notice that can help you understand more about the event?
- Investigate another location. Can you find an extreme precipitation event in the dataset?
The National Science Foundation-funded WeatherX project has developed two weather units for middle school students, one focused on exploring local weather data and one on weather at Mount Washington Observatory.
WeatherX team members also include Jo Louie, Pam Buffington, and Brianna Roche at Education Development Center; Asli Sezen-Barrie at the University of Maine; and Deb Morrison at the University of Washington.
This material is based upon work supported by the National Science Foundation under grant DRL-1900606. Any opinions, findings, and conclusions or recommendations expressed in this material are those of the author(s) and do not necessarily reflect the views of the National Science Foundation.