Climate change, and the rise of the natural hazards that climate change brings, has been at the top of news feeds every week over the past year. Extreme events such as floods, droughts, and wildfires are expected to increase in the future. What does that mean for those of us living in the path of one of these hazards? Our GeoHazard project is exploring this question with middle and high school teachers and students across the country.
As the pandemic was set to affect the 2020-21 school year, we released a number of our Earth and environmental science modules for use in online, hybrid, and in-person school settings. After early testing with a small group of teachers, we were determined to make our beta version of the GeoHazard Hurricane Module available to as many classrooms as possible, and were excited that it was one of the most popular new resources on our STEM Resource Finder.
We are pleased to announce that a newly revised version of the hurricane module, associated assessments, and teacher support materials are now available.
The revision reflects our analysis of student responses to questions embedded in the module, which allowed us to:
- identify issues in students’ understanding of key concepts,
- uncover misconceptions around the embedded visualizations, and
- pinpoint areas that would benefit from further class discussion.
At the same time, we also created two additional GeoHazard modules, one on wildfires and another on inland flooding. While developing these new resources, our thinking about how to help students consider risk and uncertainty also evolved.
These data all informed deep revisions to the Hurricane Module.
First, we added explicit claim-evidence-reasoning questions. Throughout the Hurricane Module, students are asked to run investigations with models and real-world data. Students now write arguments in the CER format, and explain their uncertainty as well. Like scientists, students use the Hurricane Explorer to investigate factors such as sea surface temperature, surface winds, and pressure systems, and explore how these factors affect where hurricanes may travel and why they might strengthen. Students also examine hurricane predictions and hurricane tracks to learn why hurricane prediction is inherently uncertain, therefore making the risks of hurricane hazards and impacts also uncertain. Based on these revisions, we have also modified some of the items in the pre- and post-tests.
Second, additional discussion prompts have been added to the Teacher Edition of the module to help teachers and students talk about societal factors that may influence people’s risk of hurricane impacts. The Washington Post reported that over the summer of 2021, one in three people in the U.S. had experienced at least one extreme weather disaster linked to climate change, so it’s likely that many students have firsthand experience with such hazards. But talking about human vulnerability to natural hazards is a sensitive topic. The module begins by asking students if they, or anyone they know, has been impacted by a hurricane. New teacher materials provide scaffolding on how to handle these sorts of topics in the classroom, including, for instance, disproportionate impacts on vulnerable populations as well as stories of hope and resilience.
Third, enhancements to the Hurricane Explorer model, specifically around how sea surface temperature is displayed and measured, allow students to better understand how warm ocean waters fuel hurricanes. Because sea surface temperature is so important to connecting the role of climate change to hurricane risks, we designed a tool to more clearly measure sea surface temperature in our model. We also added a second color gradient to enable colorblind students to see variations in the map more clearly. Other model improvements were designed to help students consider the risk to both coastal and inland communities, especially around storm surge and flood hazards.
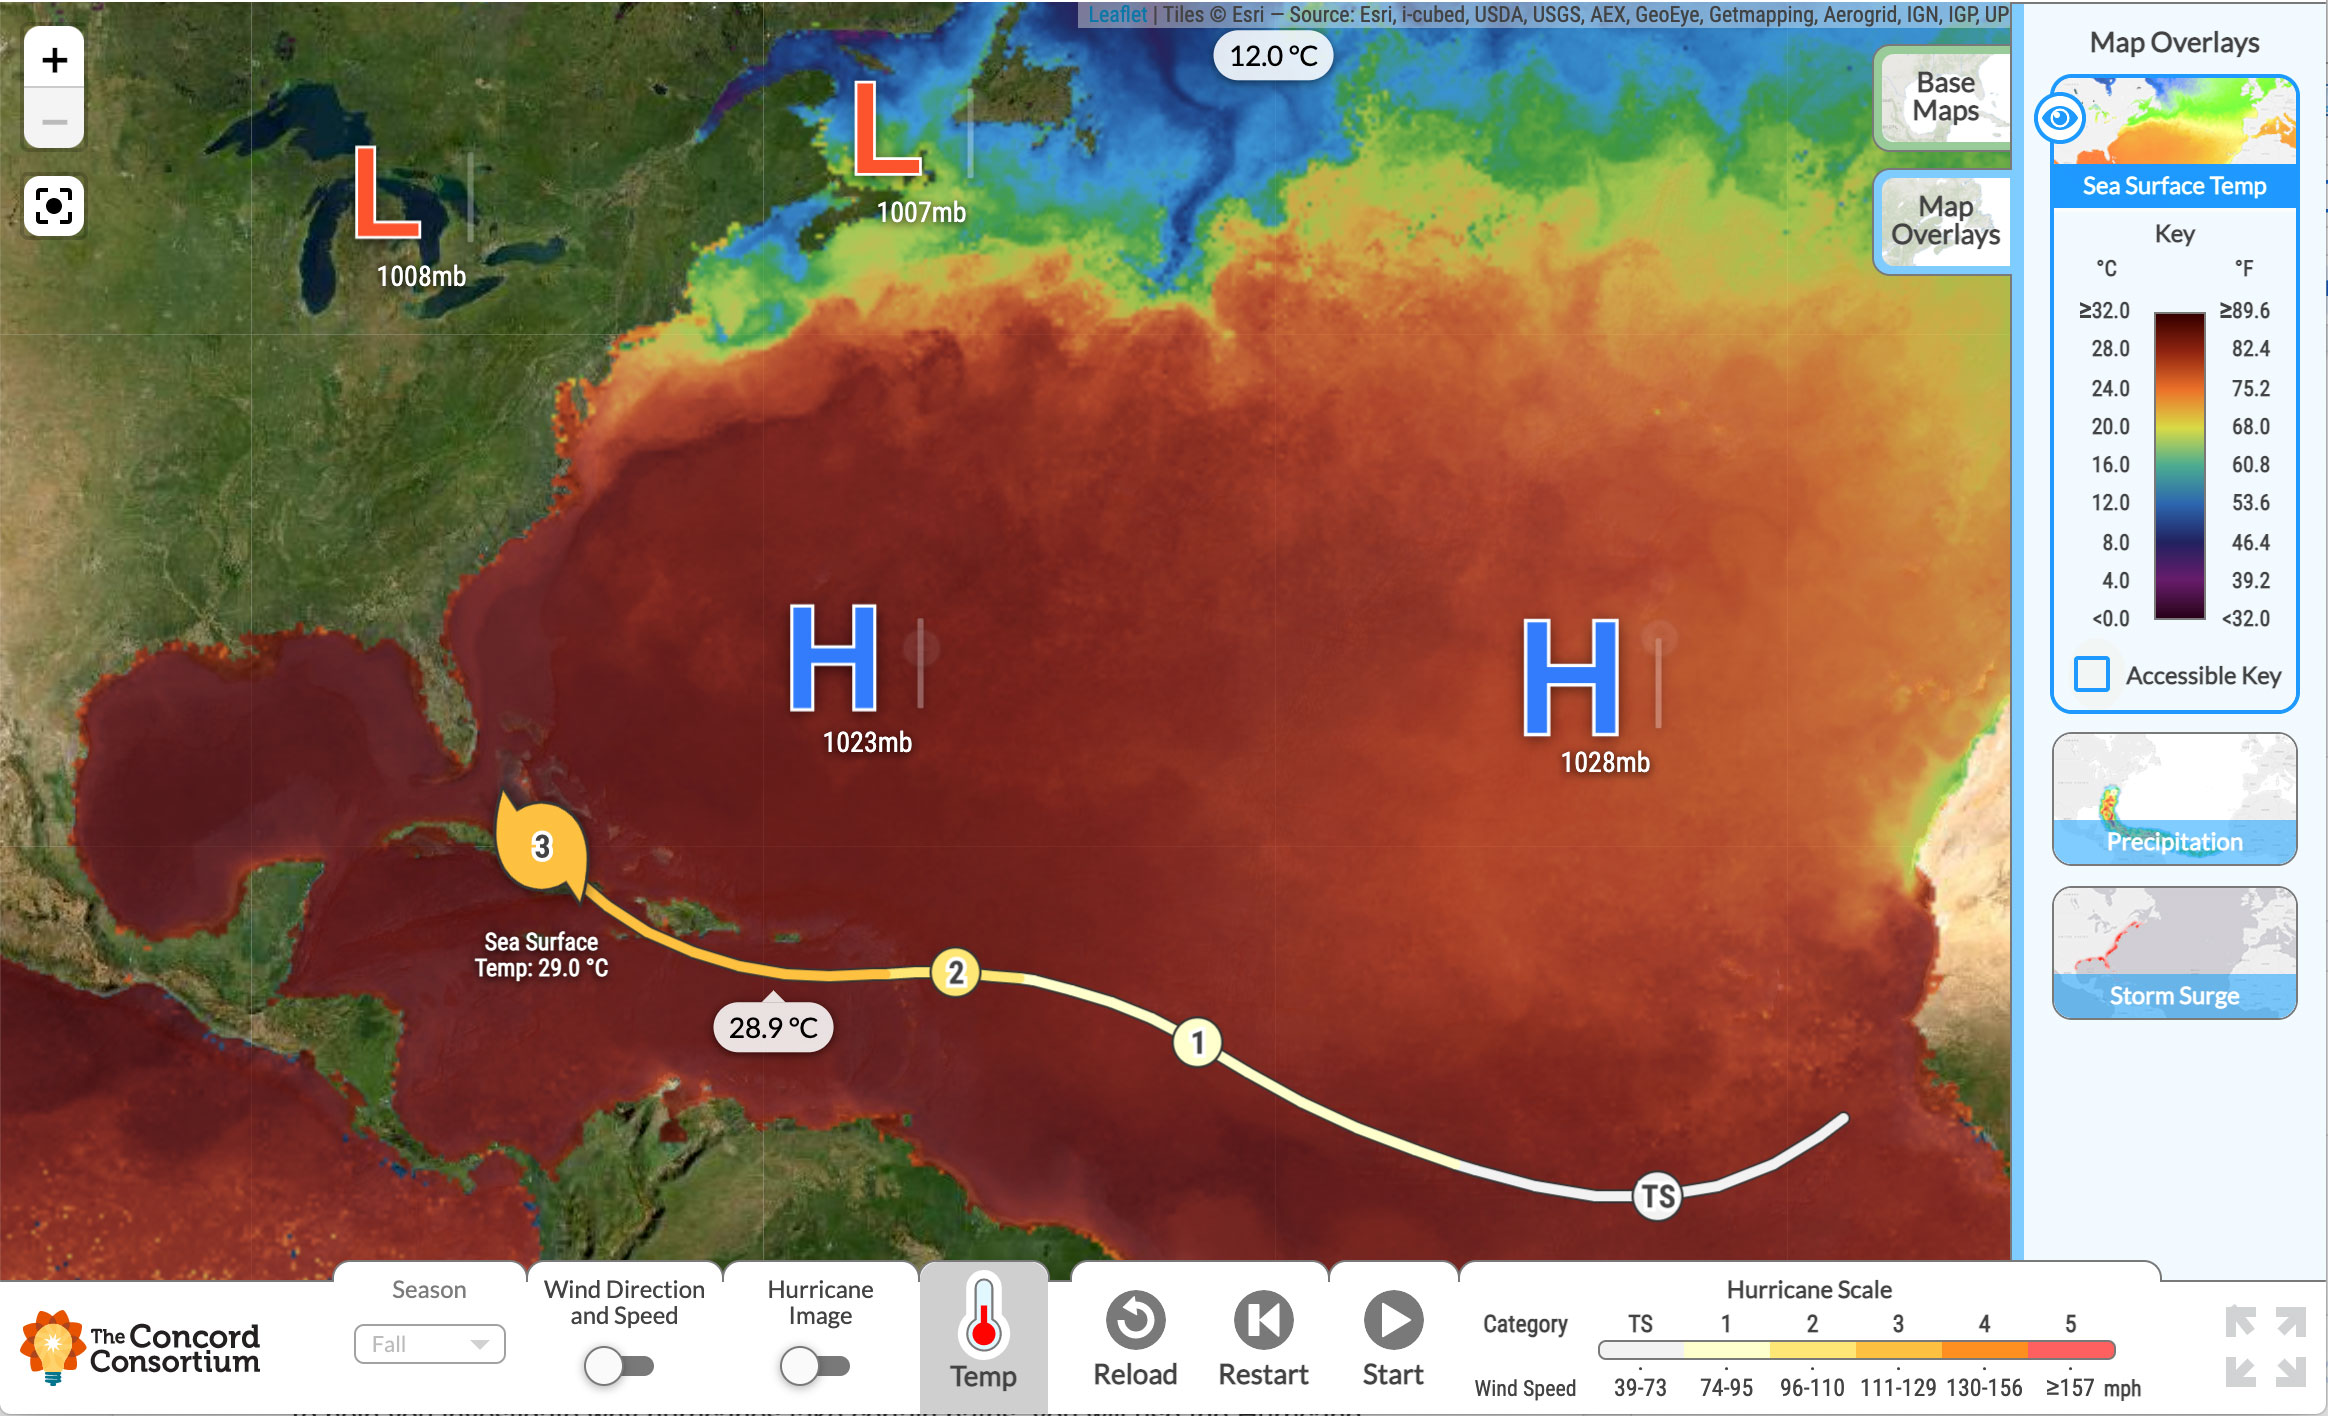 Sea surface temperature using the standard color gradient.
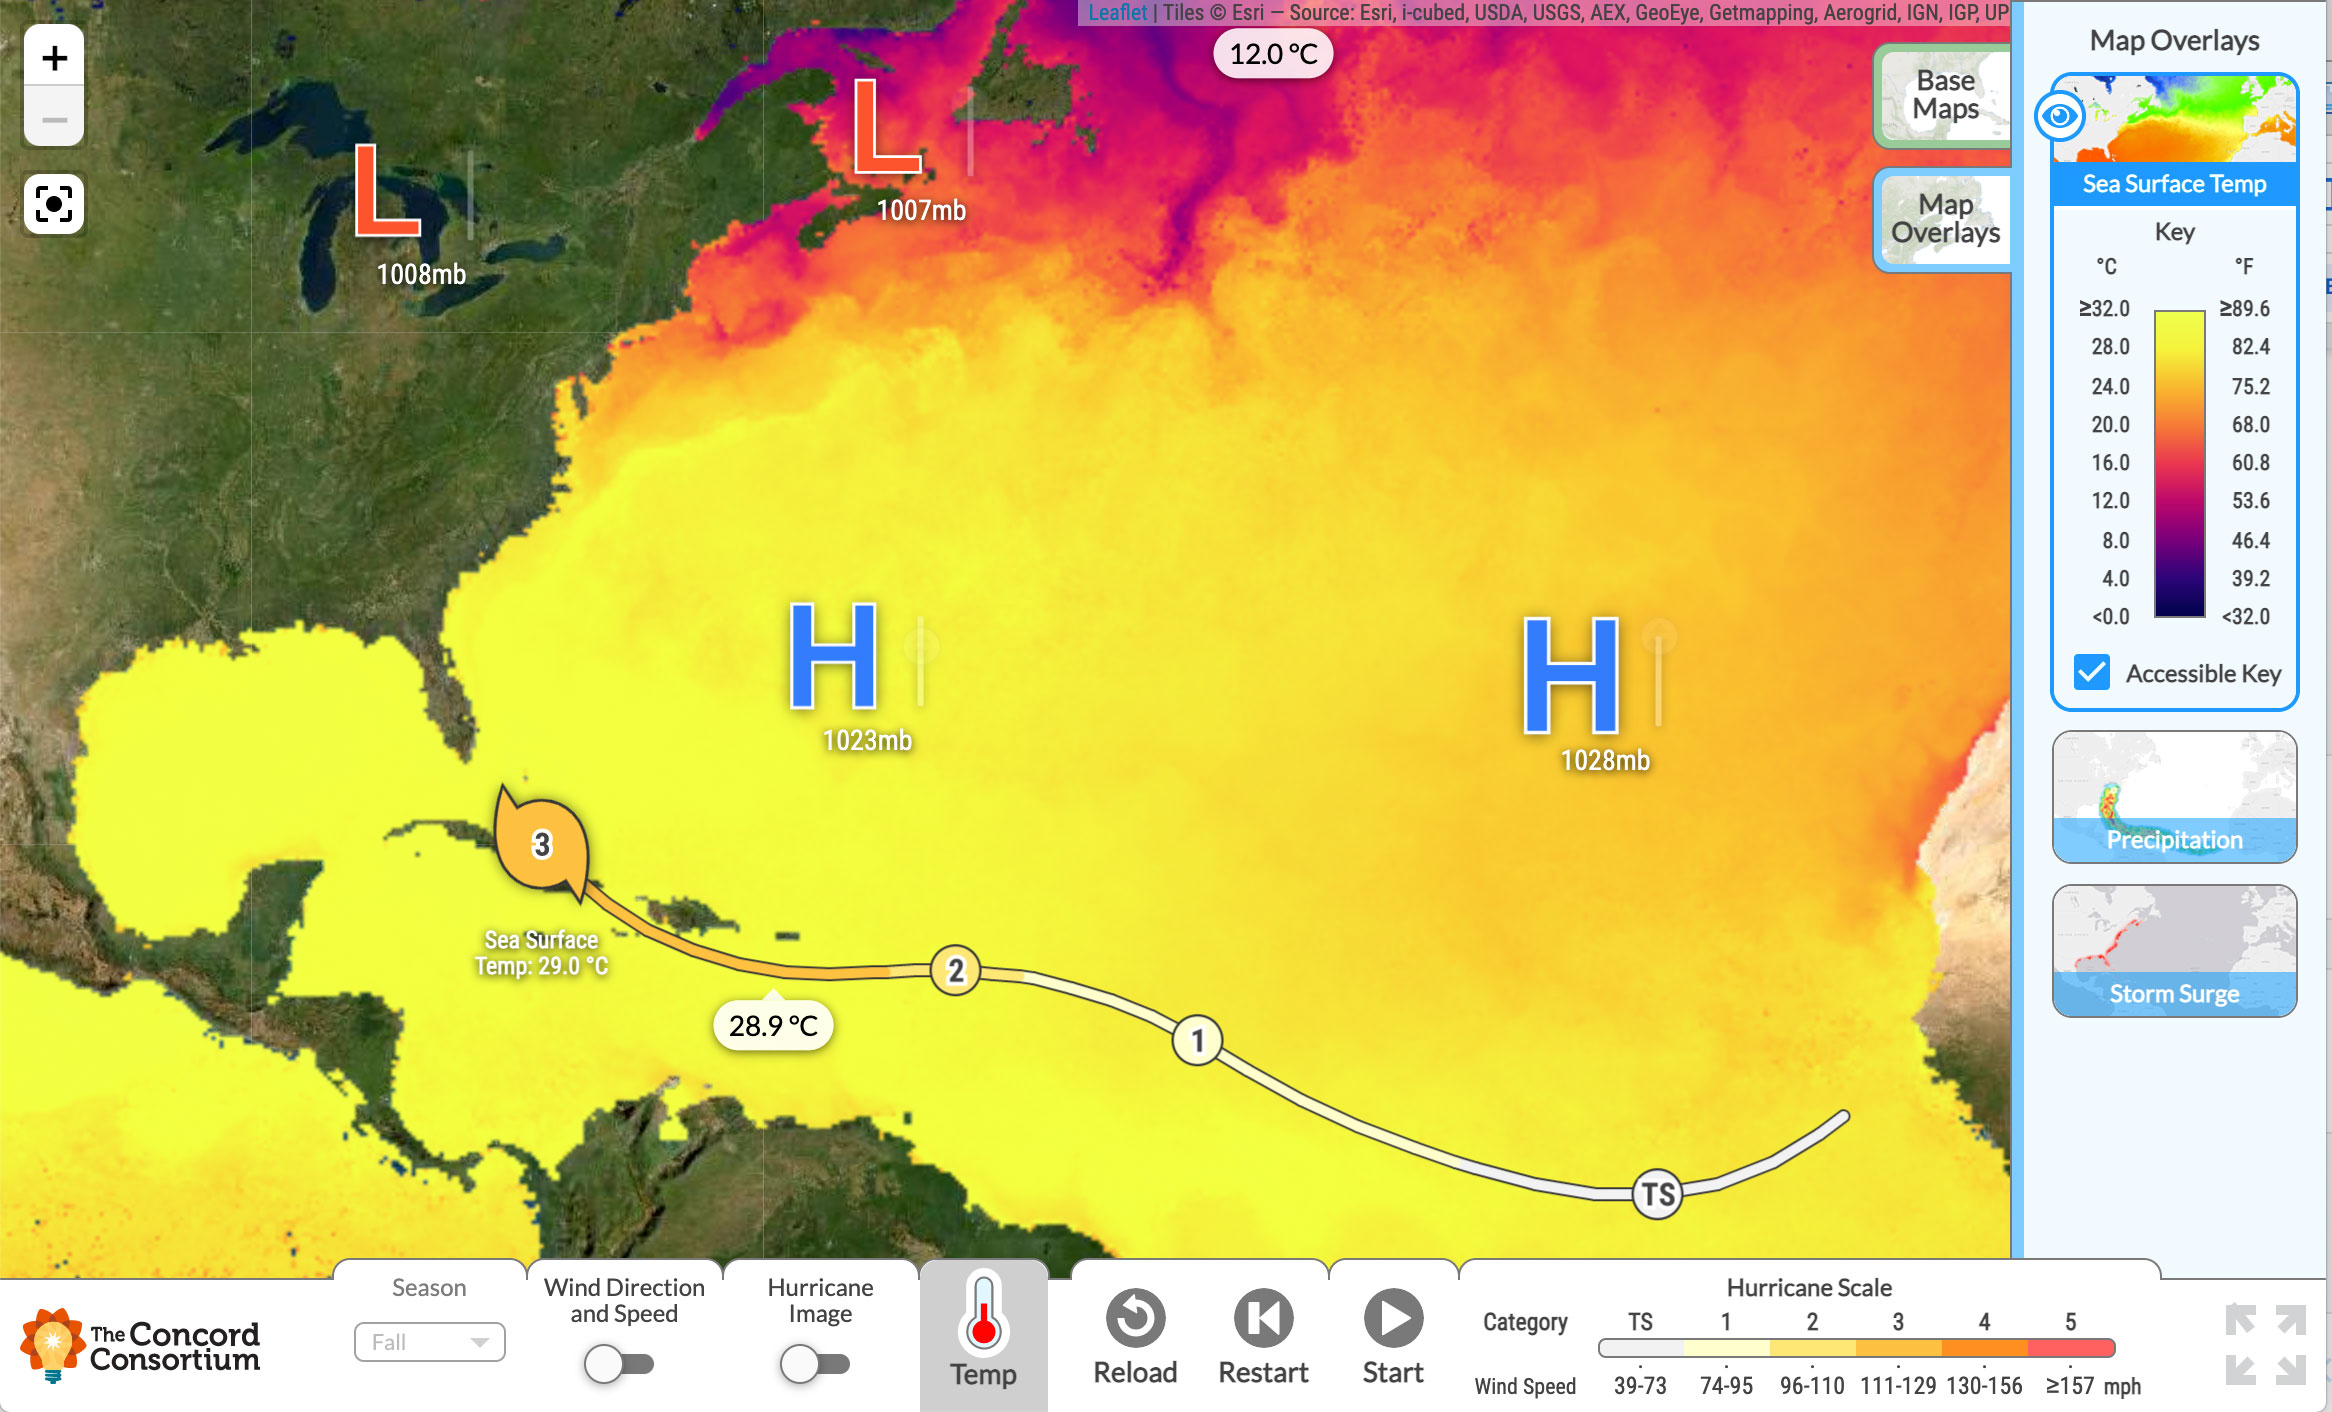
Sea surface temperature color gradient enhanced for colorblind students.
We invite you to try the Hurricane Module and Hurricane Explorer with your students! Please send your questions and comments to earth@concord.org.