Let’s face it, three-dimensional teaching takes work. There are disciplinary core ideas (DCI), science and engineering practices (SEP), and crosscutting concepts (CCC) to pack in. A simple new tool may help biology classes reap the benefits of Next Generation Science Standards instruction with big payoffs.
The 3D Teacher Moves Table, developed for a groundbreaking webinar that brought together our Common Online Data Analysis Platform (CODAP) with Wisconsin Fast Plants® and Carolina Biological, foregrounds active approaches teachers can use to bring each dimension to the classroom.
Almost 200 teachers attended the Fast Plants with CODAP webinar, designed to infuse a genetics investigation with interactive data analysis and three-dimensional teaching. The investigation focuses on NGSS disciplinary core ideas of LS3-1 regarding inheritance and variation of traits. The webinar recording and supporting teaching materials are available for free.
The 3D Teacher Moves Table
The 3D Teacher Moves Table guides high school biology teachers as they prepare for and enact a lesson called “Using Fast Plants observations and data analysis to investigate variation and how traits are inherited.” The table was created with Hedi Baxter Lauffer, Director of Teaching and Learning at the Wisconsin Fast Plants® Program, University of Wisconsin-Madison, and we hope it will serve as a model for teachers to outline other lessons and for curriculum developers to structure support material.
In particular, we focus “teacher moves” on supporting data analysis. And to make an overt plant analogy, we’re sowing the seeds of inquiry, emphasizing an approach that includes prompts and practical tips on how each stage of the lesson can play out along one, two, or all three NGSS dimensions. A concise table is available for each stage of the lesson and contains:
- What’s happening in the classroom
- Primary intention of the teacher-student interaction
- A suggested teacher move
- What students are doing in response
- How the three NGSS dimensions are enacted in what the students are doing
For example, after students have collected data on the stem color trait of a new generation of Fast Plants and entered it into CODAP, it’s time for them to compare their real-world results with the prediction of their models.
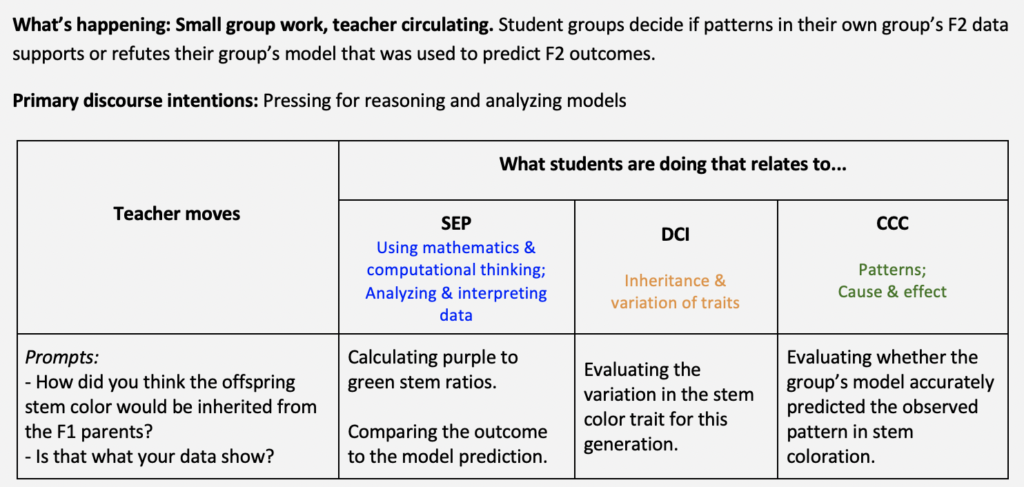
Excerpt from the 3D Teacher Moves Table for one stage in the lesson.
The teacher moves suggest questions to frame student activities at this stage of the investigation. In this case, the first prompt reminds students to think about the prediction that resulted from their model, and the second emphasizes that students compare their prediction to their current results, which they must calculate.
The gerunds beneath each dimension highlight the most relevant focus of student actions – what they are doing. These snapshot reminders can serve to help teachers make small pedagogical adjustments, for instance, pointing toward a particular approach to responding to student questions or steering a discussion in a more productive direction. For example, knowing that students are “evaluating the variation in the stem color trait” reminds teachers that students should be in the driver’s seat at this stage. When students ask for assistance, responses should help them understand how they can evaluate. This may mean pushing students to think of numerical ways to compare results across different groups, or if students are already headed in a productive direction, a tip on how to use CODAP to get there.
Student actions sometimes do double duty, based on the overlapping nature of crosscutting concepts with practices and DCIs. In the example above, there are similar student actions in the SEP and CCC table cells because data analysis (SEP) overlaps considerably with patterns (CCC). On the other hand, in the full Teacher Moves Table online, some table cells are currently empty. We invite you to share ideas for 3D instruction to fill in the gaps as you enact this or other similar lessons. (To access the full Teacher Moves Table, download the Fast Plants Webinar Investigation from the webinar home page, and see Appendix B.)
Lesson: Using Fast Plants and data analysis
The “Using Fast Plants observations and data analysis” lesson can stimulate students’ curiosity, direct them toward modeling a genetic inheritance pattern, and sprinkle in the whys and hows of intrinsic variation in real scientific data.
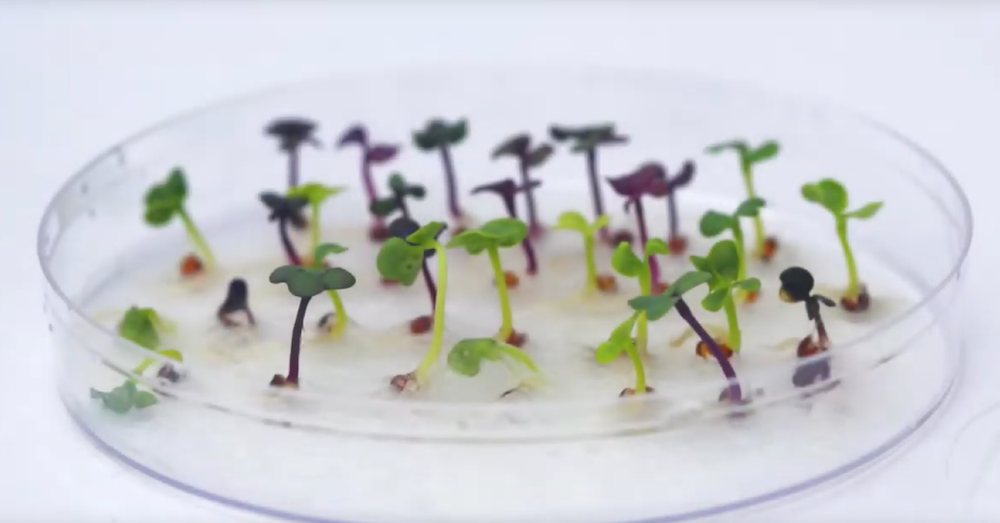
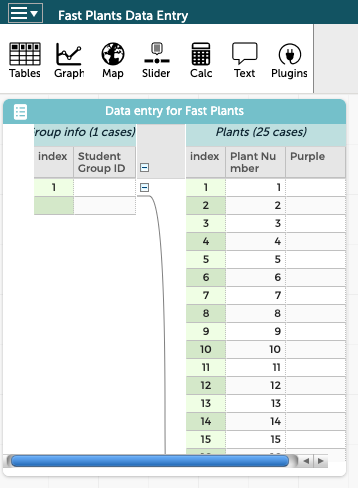
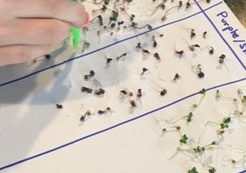
Wisconsin Fast Plants grow in petri dish (upper left). Students record stem color on paper (lower left), then enter data in CODAP (right).
Wisconsin Fast Plants 72-hour seedlings have an easy-to-score stem color phenotype (purple or green). Working from a first generation (F1) of all purple stem plants, students try to determine a “mystery father” (P1) plant’s stem color. They develop models to explain their ideas about the father’s trait and then use their models to predict what will happen when the purple stem offspring generation are intermated to produce a second offspring generation (F2) that are grown from paper seed discs in normal lighting.
Three days later, student groups collect data on stem color, enter it into CODAP, and compare with their model’s predictions. Students use CODAP to analyze and interpret their Fast Plants F2 generation data, advancing their skills to use data as evidence to support a claim. The data from all groups is then combined in CODAP, analyzed, and compared to the individual group’s data and models. An optional lesson using a simulation in CODAP explores how random events can result in a predictable pattern, helping students understand the use of a Punnett square.
CODAP is a free, web-based exploratory, immersive environment for students in grades 5-14 to analyze and visualize data. Fast Plants are a wonderful model species that go from seed to seed in 40 days, making it possible to study everything from the plant life cycle to photosynthesis and genetics with hands-on experiments. Carolina Biological is a leading supplier of science teaching materials, including Fast Plants.
Note: To adapt this lesson for remote learning, teachers can grow Fast Plants and share images of their petri dishes. Students can score them and generate their own data to analyze in CODAP, which is free and runs in a web browser, without any login or installation required.