The High-Adventure Science modules, first written in 2011-2013, are each based on a big unanswered question in Earth/environmental science. These six modules include interactive computer-based systems models and real-world data that students use for evidence as they develop scientific arguments.
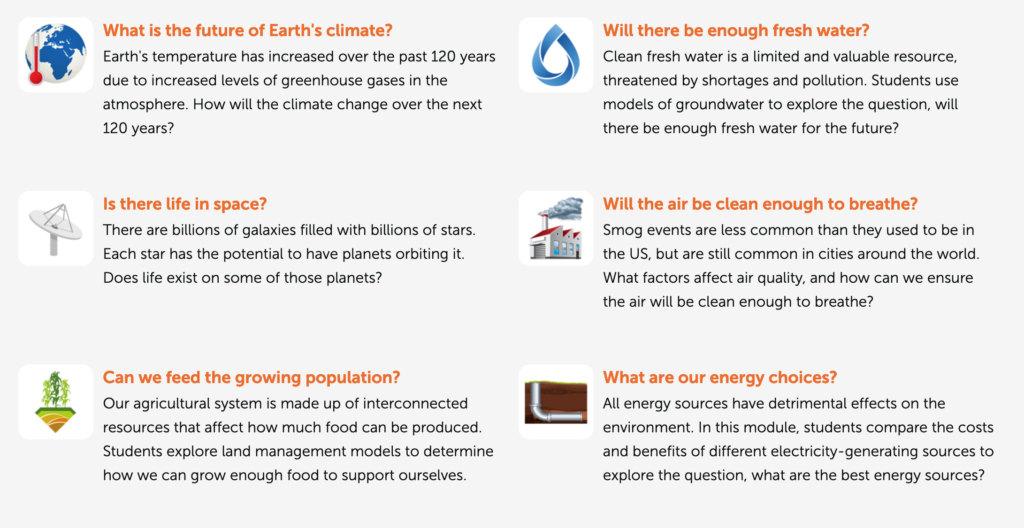
The modules incorporate real-world data from the National Aeronautic and Space Administration, National Oceanic and Atmospheric Administration, Environmental Protection Agency, United States Department of Agriculture, and Energy Information Administration.
Nearly 10 years later, the big unanswered questions are still unanswered. But 10 years is a lot of time in cutting-edge science. Scientists have generated a lot more data as they have continued to investigate these topics. Over the past couple of weeks, we have updated each of the High-Adventure Science modules with the most-recent available datasets from NASA, NOAA, EPA, USDA, and EIA.
Since we first wrote the space module, scientists have discovered hundreds more exoplanets and investigated their atmospheres for the presence of materials that could indicate life.
Scientists have continued collecting data on Earth’s temperature and levels of greenhouse gases in its atmosphere.
Scientists’ understanding of freshwater resources and air pollution have continued to evolve, as has their understanding of best land management processes to preserve and enhance soil quality.
Perhaps the largest changes have happened in the energy sector. In 2012, the United States was just starting to experience the boom in natural gas production from shale. Coal was still the major energy source for generating electricity in the United States. In 2020, natural gas use has surpassed coal use. The rise in use of renewables (solar, wind) has increased dramatically.
You can investigate just how much the electricity-generation mix has changed in the United States with an interactive in the energy module. The pie charts show the energy mix from 1990 until 2018 (the most recent available data). You can see how coal (black color) was the majority energy source until about 2008. Natural gas (yellow color) has made up most of the replacement to coal energy. The rise of wind and solar has been dramatic as well. Starting from next-to-nothing in 2007, they comprise a visible and growing portion of the United States’ energy mix.
The line graph shows the total amount of electricity generated in the United States over the same time period. From this, you can see that, as a country, electricity generation has neither increased nor decreased dramatically. (Note that the graph is logarithmic.)
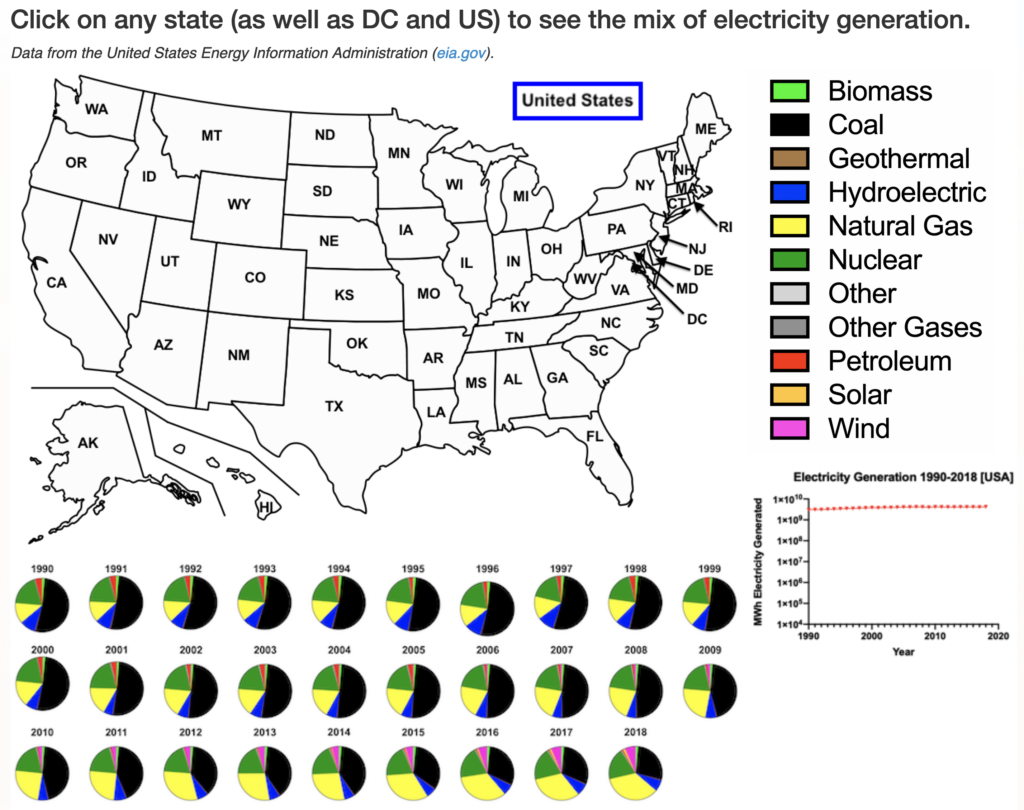
Similar data sets are available for each of the states and District of Columbia. Comparing the energy mixes in the states gives a good sense of the different availability of resources around the country. For instance, over the past decade Kansas and Oklahoma have generated a growing percentage of its electricity from wind. The Pacific Northwest derives much of their electricity from hydropower. From these data, one can conclude that Kansas and Oklahoma must have good wind availability and the Pacific Northwest must have powerful rivers and dams.
Science continues to advance as scientists generate more and more data. The changes at the cutting edge are exciting, and we are excited to share more real-world science with teachers and their students.
Read how one teacher has used the land module with her students in this Science Teacher article: Using Scientific Argumentation to Understand Human Impact on the Earth. For more articles about the High-Adventure Science modules, check out our Publications page.
To use High-Adventure Science models or modules with your students, start at https://learn.concord.org/has. Modules are freely available to all teachers and students.