Kilauea, Hawai’i’s youngest and most active volcano, has been continuously erupting since 1983. But it made news again recently with large earthquakes and lava fountains erupting in residential areas.
Have you ever wondered what’s going on with Kilauea? Can scientists predict when and where a volcano will next erupt?
You can use Seismic Explorer to explore the locations of volcanoes and earthquakes in the Hawaiian Islands. In this zoomed-in view from Seismic Explorer, you can see the locations of Hawai’i’s active volcanoes.
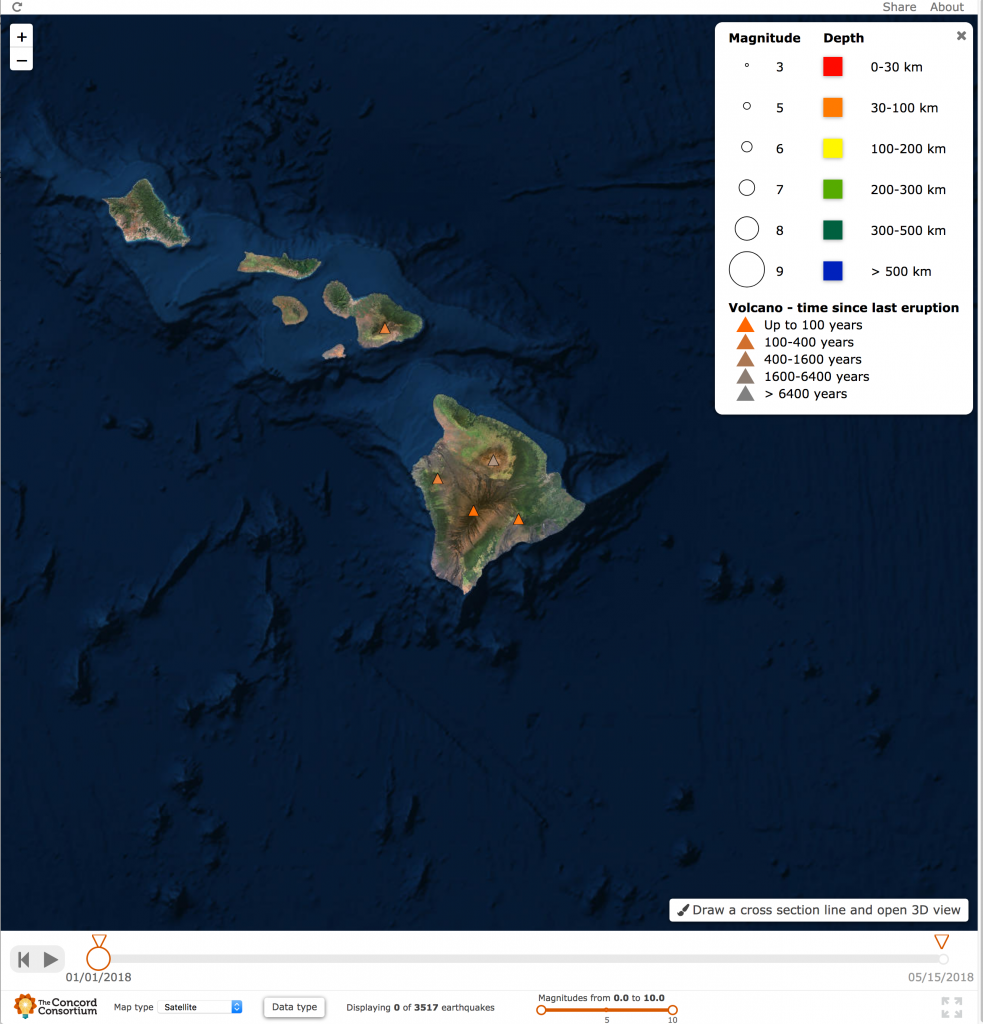
Launch Seismic Explorer and click the Play button to show the earthquakes that have occurred in the Hawaiian Islands since January 2018. Using just the earthquake data, can you tell when and where the volcano erupted?
Why is Kilauea erupting? How did the Hawaiian Islands form?
The Hawaiian Islands are the result of a geological hotspot. At hotspots, magma rises to the surface and breaks through Earth’s crust, resulting in volcanoes.
If you choose the ocean basemap map type in Seismic Explorer, you’ll be able to see that the Hawaiian Islands are on one end of a long chain of underwater mountains. (The lighter colors represent higher elevations.)
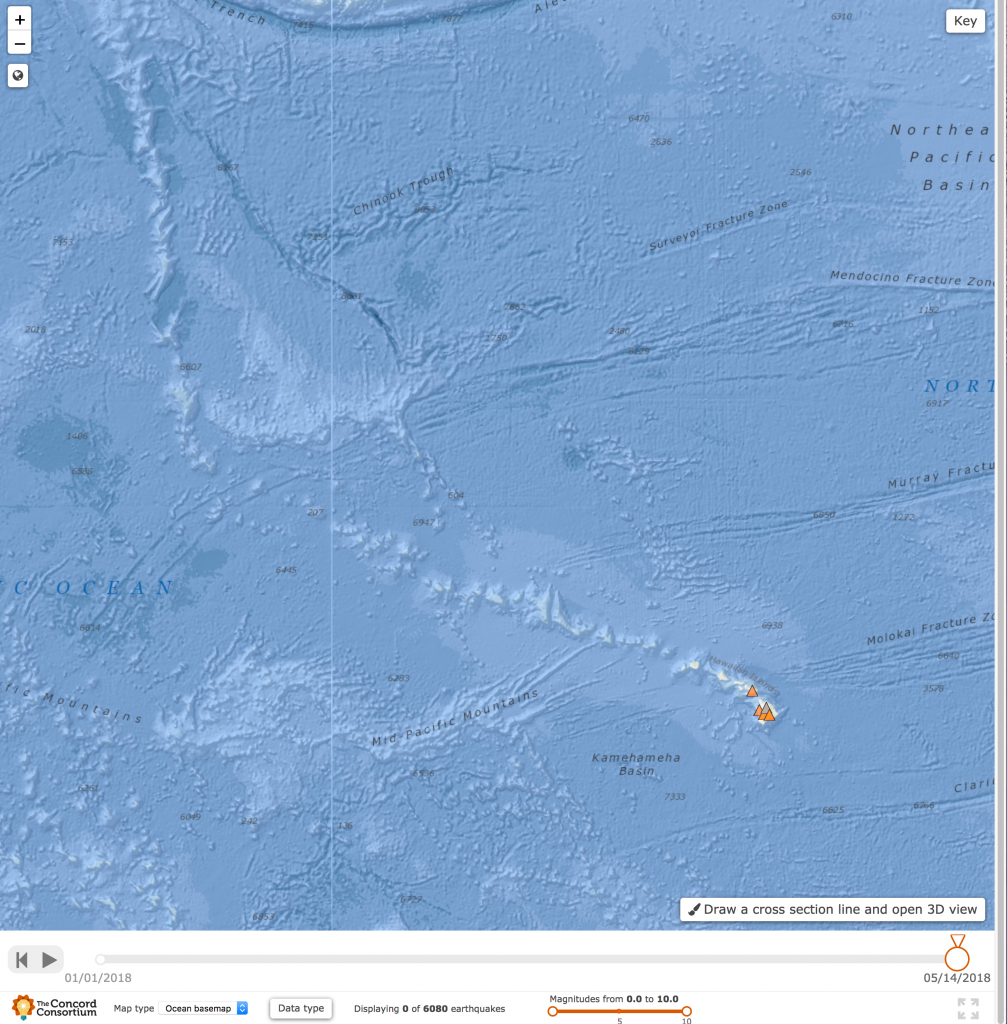

The Hawaiian Islands are the youngest mountains in this chain. The current volcanic activity shows that the Hawaiian Islands are still being formed.
So, why is there a chain of islands instead of one big island? Has the hotspot moved? You can use Seismic Explorer to get some clues to answer this question as well.
Hawai’i is located in the middle of the Pacific Plate, one of Earth’s many tectonic plates. Tectonic plates are composed of the crust (the part of Earth you can see) and the upper part of the mantle. Using the plate boundaries and plate movement data, you can explore the motion of the Pacific Plate.
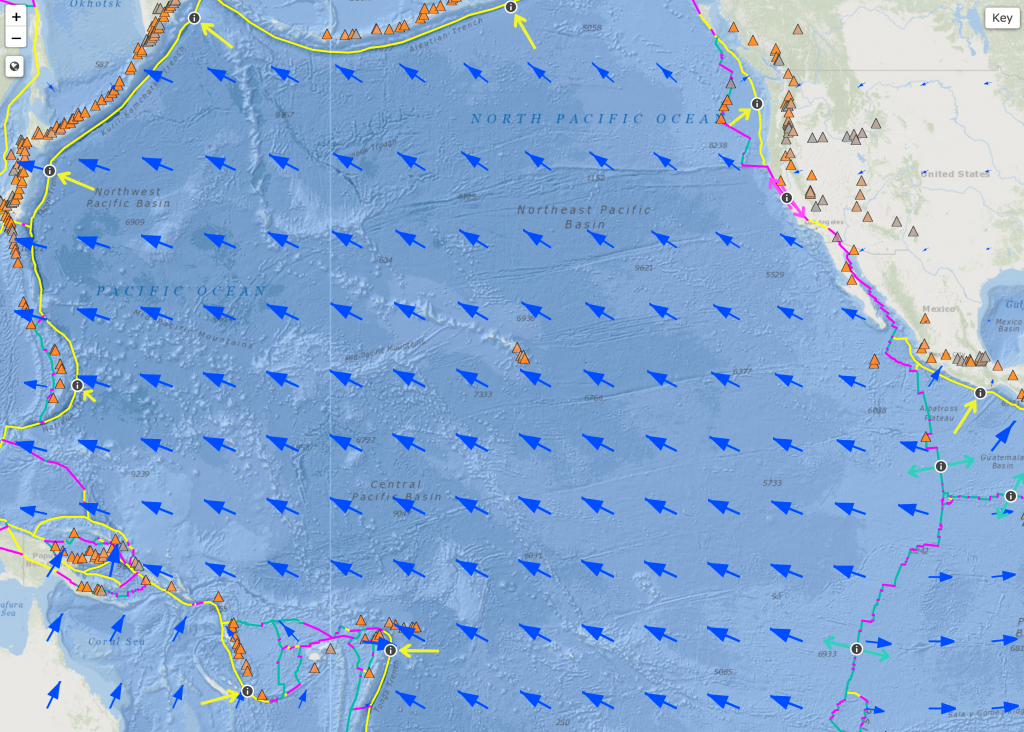

The detailed plate movement arrows show that the Pacific Plate has been moving to the northwest. The hotspot has remained stationary, and as the Pacific Plate has moved, the island chain has grown. Older islands in the chain were moved away from the hotspot, and over millions of years, they were eroded so that they’re no longer above sea level.
Even though Seismic Explorer shows only the current activity, you can use the data to make inferences about the past and predictions about the future.
Using data to figure out the past
You may have noticed that there is a bend in the underwater island chain. Can you explain what happened there? How must the Pacific Plate have been moving at that time?
Using data to predict the future
Can you use the plate motion data to predict the location of the next active volcano in this chain?
Using Seismic Explorer to explore other areas on Earth
Geological hotspots are the least common places for volcanoes. Most volcanoes on Earth are the result of convergent plate boundaries, where two plates move towards each other, like the volcanoes of Japan and the Andes Mountains of South America. Some volcanoes form along divergent boundaries, like the volcanoes of Iceland.
You can use Seismic Explorer to explore all of Earth’s volcanoes and earthquakes. Try using the cross section tool to get a 3D underground view of earthquakes.
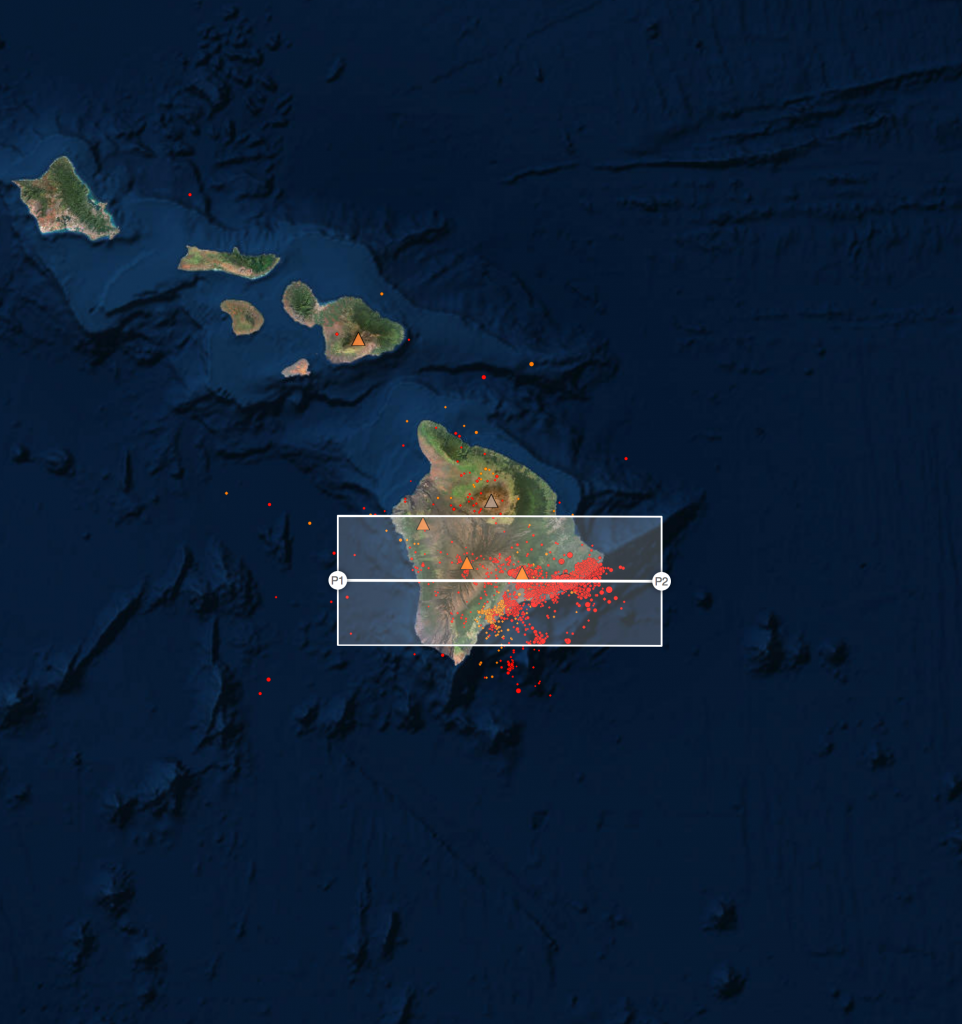

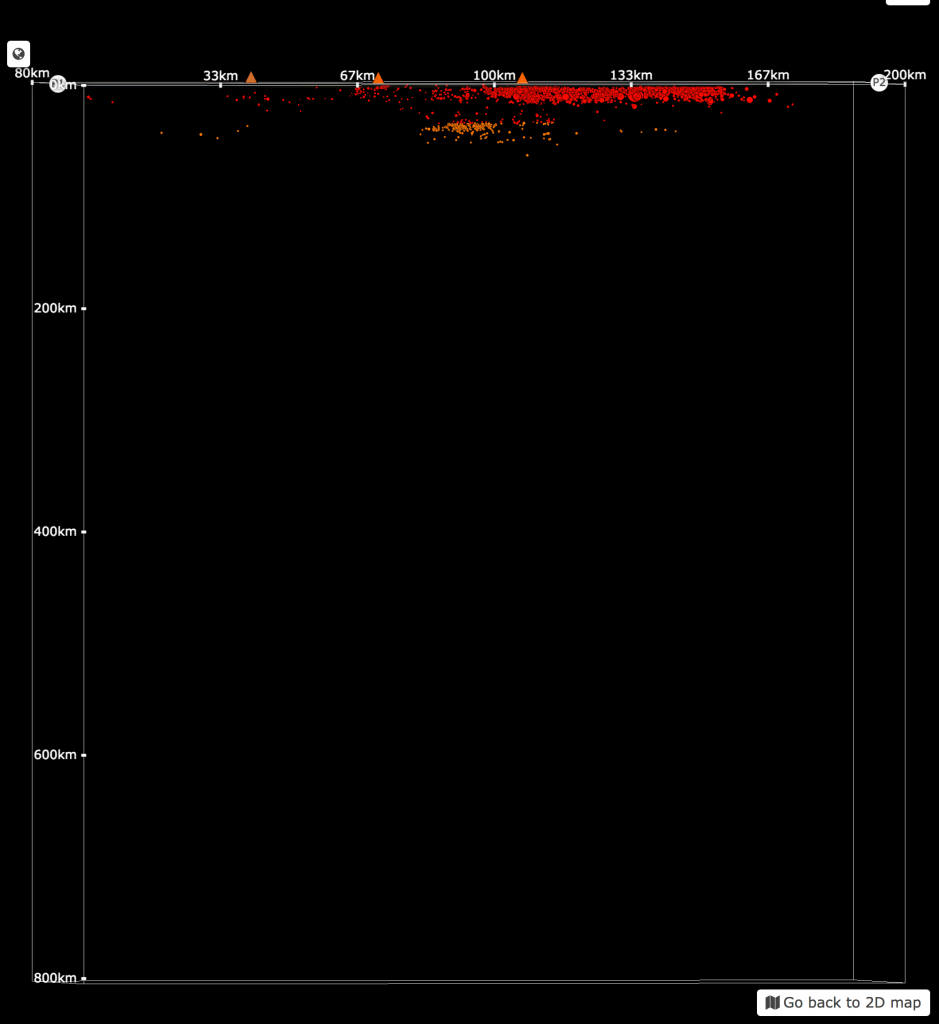

How are the patterns of earthquakes different at different types of volcanoes? Compare the Hawaiian volcanoes to volcanoes in the Andes to volcanoes in Iceland. (Spoiler alert – the views are very different!) Along the plate boundaries, make sure to draw your cross section perpendicular to the lines of earthquakes – that way, you’ll be able to see the patterns of earthquakes along each boundary.
If you’re interested in exploring more about plate tectonics, earthquakes, and volcanoes, check out the GEODE activities in the STEM Resource Finder. You’ll find links to models, like Seismic Explorer, and classroom activities. You’ll also find links to sign up to be a field test teacher and help us test the latest plate tectonics models and curricula.
The GEODE project, funded by the National Science Foundation, is developing computational models of plate tectonics and associated curricula for the middle and high school level.