Want to introduce data science with CODAP to your middle and high school students? Through a partnership with Bootstrap, you can get started with a free web-based set of materials. Developed by the Bootstrap team, the Data Literacy curriculum is a comprehensive, flexible data literacy course designed for students in grades 7-9 that uses CODAP to teach core concepts of data science.
It begins with an Introduction to Data Science and includes a full sequence of lessons, including core concepts such as Exploring CODAP, Bar Charts, Dot Plots, The Data Cycle, and Probability and Sampling. More advanced topics include Histograms, Measures of Center, Scatter Plots, Correlation, and Linear Regression.
Special projects, including Make an Infographic, Snack Habits, Dataset Exploration, and a Research Capstone give students hands-on practice analyzing real datasets and applying what they learn to authentic questions. There’s even a project called “When Data Science Goes Bad” in which students investigate four types of threats to validity by pretending to be “bad data scientists” who fail to consider the impact of selection bias, bias in the study design, poor choice of summary data, and confounding variables.
Lessons are structured around a launch-investigate-synthesize pattern. The entire course is available in a student workbook (PDF), with individual online lessons pointing to appropriate pages. Teacher resources include standards alignment, glossaries, slides, lesson guides, and a community forum.
Introduction to data science
In Bootstrap’s Introduction to Data Science, students learn about categorical and numeric data using a dataset of animals from a fictional pet shelter. The dataset features charming and relatable creatures—including a cat named Mittens; dogs Boo-boo, Midnight, and Mr. Peanutbutter; and a tarantula named Snuggles. Along the way, students consider what questions can—and cannot—be answered with the available data.
Working in groups of two to five, students record what they notice and wonder about the animals dataset. Then, using the four-part data cycle, students begin by asking questions. For instance, they might want to know:
- Are dogs adopted sooner than cats?
- Do smaller dogs get new homes before larger ones?
- Are older animals adopted more slowly?
Data can help answer questions like these.

Animals dataset in CODAP used in the Bootstrap Introduction to Data Science.
In this introductory lesson, the goal is for students to be able to:
- Explain the difference between categorical and quantitative data, recognizing that quantitative data measures an amount while categorical data is used to qualify.
- Identify whether a variable in a dataset is categorical or quantitative by considering whether the data tells us “what kind?” or “how much?”
According to the lesson slides for teachers, which includes teacher tips and answers as presenter notes, “Categorical data is used to classify, not measure. The laws of arithmetic do not make sense when it comes to categorical data!”
Students are asked to name the categorical values in the dataset. (Answer: Species, Name, Sex, and Fixed.) Quantitative variables include Age, Legs, Weight, and Time to Adoption.
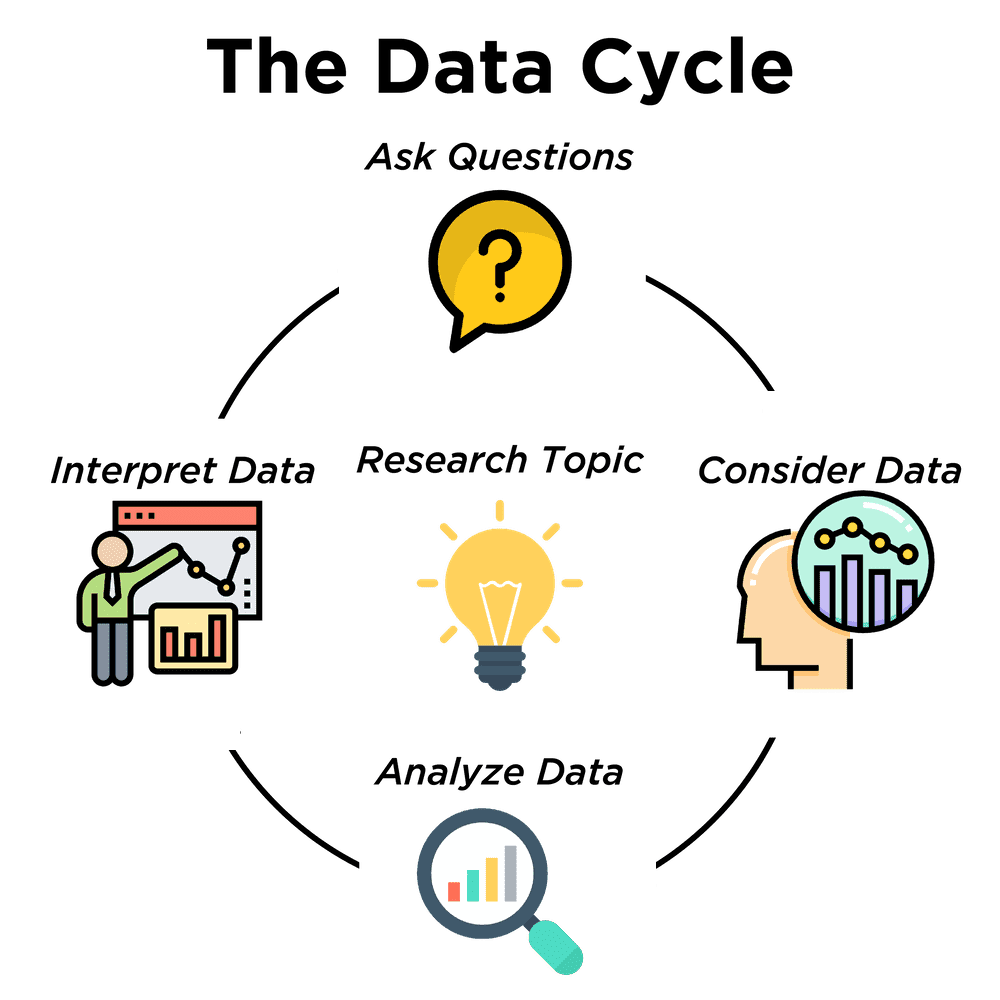
The data cycle is a four-step scaffold for answering questions from a dataset.
Next, students consider data, determining which parts of the dataset they need to answer their question. To analyze data, students complete calculations, create data visualizations, create new tables, or filter existing tables. The results of this step are calculations, patterns, and relationships. Finally, students interpret data by answering the original question, summarizing the process to get there, and the results. The data cycle may lead to new questions and the cycle starts again!
Transformers plugin
Our friends and colleagues at Bootstrap also developed the Transformers plugin for CODAP. This powerful plugin—found in the Data Moves submenu of Plugins—includes 30 transformations, allowing students to filter and sort attributes, and to measure, aggregate, and summarize data, among many other transformations.
Students can transform datasets to produce new datasets without modifying the original dataset, enabling easy “what if” exploration and comparison of datasets that may represent distinct transformations performed on the same source dataset.

The Transformers plugin (right) with animals sorted by age (lower left).
The result of one Transformer can be used as an input to another, leading to a sequence of datasets, each a transformed version of the previous. This approach can be especially useful for documenting the specific steps used to process the data or change its structure.
More CODAP resources
With funding from the Cisco Foundation, the Concord Consortium is developing additional introductory resources to quickly orient new users to the power of CODAP for data analysis and visualization. In addition to CODAP tutorials and a curated set of basic help pages, we plan to design a short introduction paired with classroom-oriented pathways, guided walkthroughs, and embedded supports.
Thanks to partners like Bootstrap and funders including the Cisco Foundation, Valhalla Foundation, the National Science Foundation, and generous individuals, we’re strengthening CODAP as a sustainable and scalable infrastructure and ecosystem. Contact us at codap@concord.org to partner with us.