Category: Tag: YouthQuake
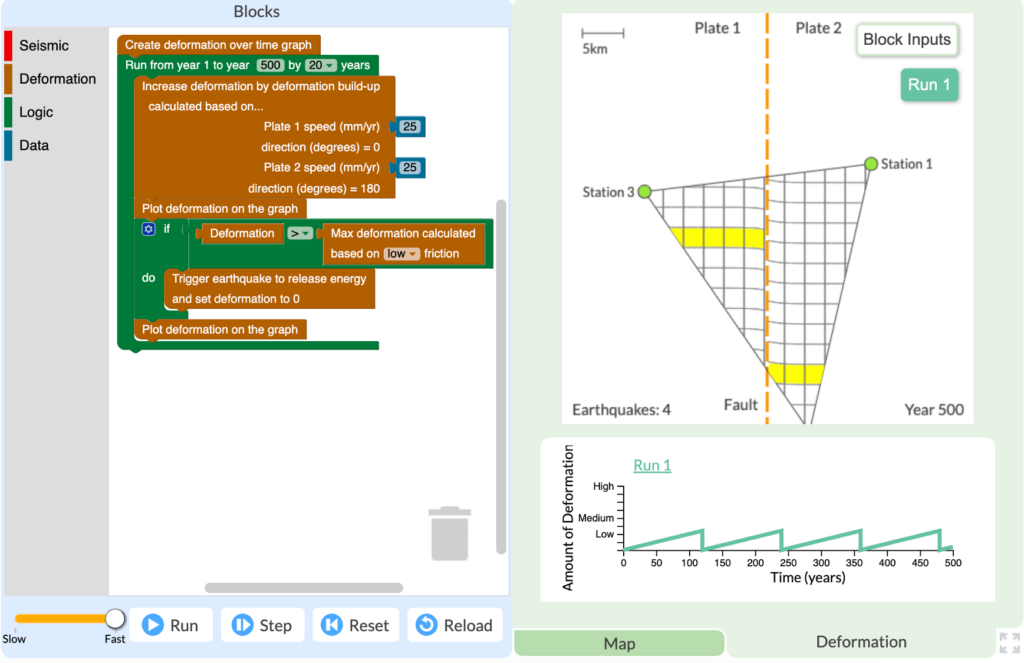
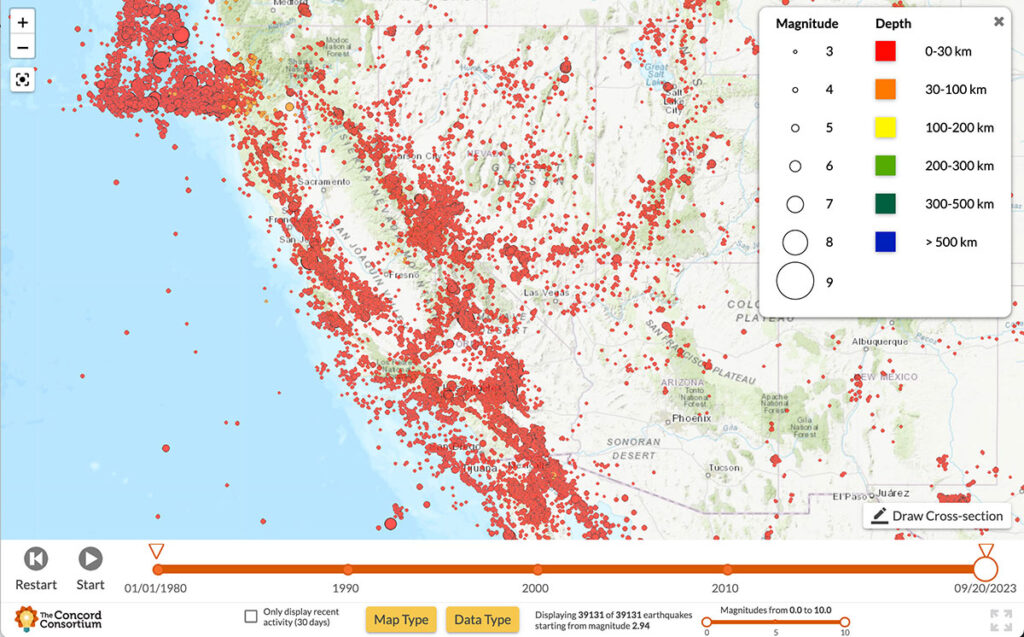
Symbols, objects, maps, graphs, and simulations are all powerful tools for conveying information. However, some complex ideas just can’t be captured in a single representation. In these cases, multiple visualizations can be used together to convey and connect several pieces of related information. For example, during the COVID-19 pandemic, news organizations used a combination of […]
With most California residents living within a 30-minute drive of one of the state’s 500 active fault zones, the threat of earthquakes looms large. Scientists are constantly monitoring seismic activity, conducting risk assessments to determine when and where earthquakes may occur, and predicting the potential impacts to surrounding communities. Our new National Science Foundation-funded YouthQuake […]

