With a deluge of data — from data about climate change and the pandemic to data about town demographics and local energy use — it is increasingly vital that the public are able to make sense of data to inform their decisions. But datasets can be overwhelming, at least at first glance. For example, census data might include dozens of attributes — age, education, income, family size, employment status, and many more. Furthermore, students typically encounter datasets only as “flat” displays of simple rows and columns in a spreadsheet. But such representations are inadequate if students want to know about how to aggregate the average income and education at the state or county level. A new project is exploring how to support students in using multidimensional data structures.
The goal of our Supporting Reasoning with Multidimensional Datasets is to produce design principles to guide technology developers, curriculum developers, and researchers in creating environments that are conducive to promoting data fluency for all learners. “We want all students to emerge from school with a sense of competence when using data to ask and answer their own questions,” says Lynn Stephens, a research scientist at the Concord Consortium and Principal Investigator of the Multidimensional Datasets project.
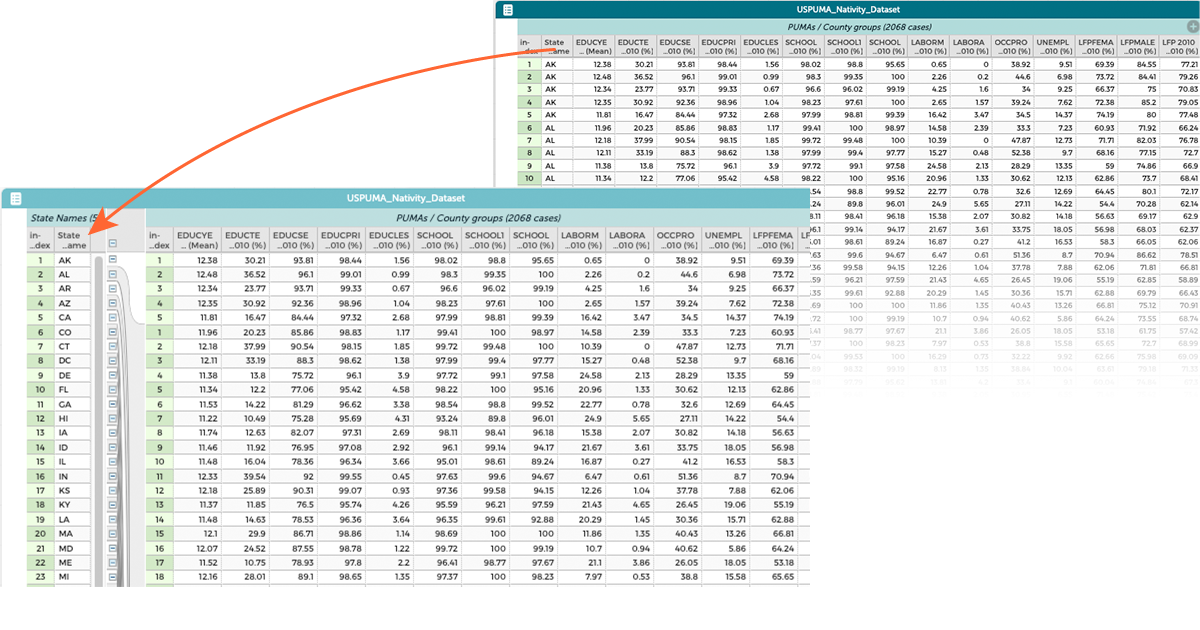
Multidimensional data represented hierarchically in CODAP. Attributes with repeated data values have been dragged to the left to group the data.
As a fundamental research project, funded through the National Science Foundation’s Core Research program, we’re starting by studying how data experts work with complex and unfamiliar datasets, asking them to “think out loud” and explain their actions as they interact with the data. These interviews will serve as a backdrop to frame our work with students. Individual and small groups of high school students will construct datasets by first producing their own data, then grouping their data with those from other students to build larger, more complicated datasets. We will probe their intuitive ways of representing multidimensional datasets and examine what teaching strategies and activities support student sensemaking about data.
Stephens and Co-Principal Investigator Dan Damelin are thrilled that the design principles will lead to new features for our Common Online Data Analysis Platform (CODAP). Damelin says, “CODAP already has a suite of features to facilitate data exploration. Scaffolding students to create and understand hierarchical data will further CODAP’s mission to make data analysis and visualization easy and enjoyable.”