Tim Erickson is an educator focusing on mathematics, physics, and data science; a consultant on several data science projects; and the author of Awash in Data.
CODAP is great for exploring data. You can make graphs and do cool data moves, such as filtering, grouping, and summarizing your data. You can download data from public sources, including the U.S. Census and NOAA, or upload anything you can put into a csv file. If you want to model some data using a function, you can make sliders for parameters, plot the function, and fit it to the data by sliding. You can even make maps!
But you might have doubts about CODAP’s ability to do Serious Statistics. You know, the kinds of things they teach in college or AP Stats: t tests, chisquare tests, confidence intervals. Real “inferential” statistics. The kind of thing you use a real Stats Package for, like R or SAS or SPSS.
Good news, CODAP fans! You can do inferential statistics in CODAP. In this post, I’ll show you one technique that you can generalize to any situation: a randomization test. I like randomization tests for learners because, from a teaching point of view, they help students experience and understand what hypothesis tests really mean.
Let’s review the logic of hypothesis tests with an example.
Suppose you’re doing an experiment, testing an anti-rash cream. You recruit 100 participants, all of whom have a minor rash. You randomly separate them into two groups of 50. The treatment group gets the real cream, while the control group gets a placebo: a cream just like the real cream but with no active ingredient. One day later, in the control group, 30 out of the 50 participants still have a rash. In the treatment group, it’s only 20 out of 50.
So your cream doesn’t help everybody, but it looks like 10 additional people got relief using the cream. Right? Are we done?
No. An important question remains: Could you have gotten that result even if the cream had no effect at all? Of course it’s possible, but let’s refine the question: Is it plausible that you would get that result even if the cream had no effect? We’ll state our question even more precisely: How likely is it that, if the cream had no effect, you would see a difference that extreme?
To figure this out, we assume something that isn’t true: the null hypothesis. That is, we’re going to use CODAP to imagine what it would be like if, in fact, the cream has no effect.
To begin, first we need the experimental data. And here is a key point: our data is not just the totals—20, 30, 50—but rather the data on the individual people. That is, we want 100 cases representing the 100 people. For each person we know what group they’re in and what their result is.
We made a dataset like that, and then a graph that displays our experimental results. If you want to follow along, click this link to get a CODAP document of your own where you can do this data analysis yourself.
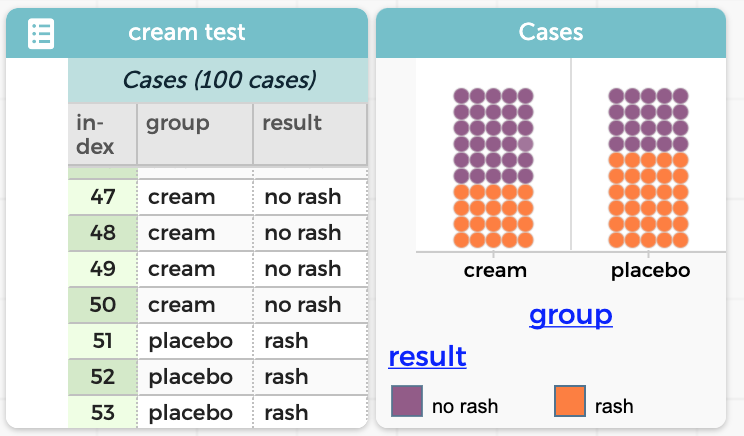
That graph clearly shows an association between group and result: you’re more likely to get a purple dot—a result of “no rash”—if group is equal to “cream.”
So now to our test. To make the null hypothesis, we want to break that association. And to do that, we are going to scramble the values in one of the columns. Then there is no relationship, right?
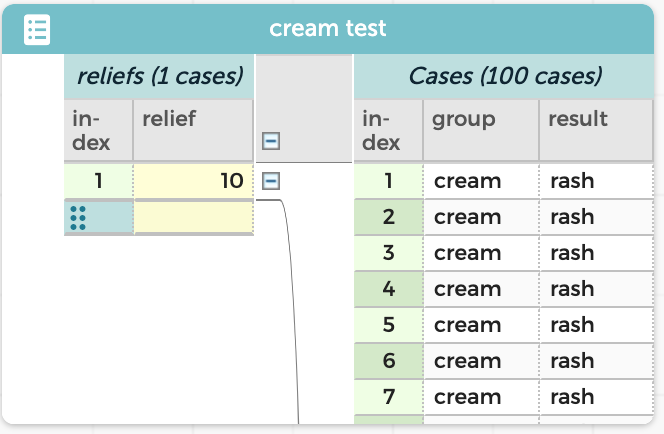
Before we scramble, though, we need one more thing: a measure. We need a number that tells us how big the association is in real life. In our case, one good measure is 10, that is, the number of people who apparently got relief from the cream.
Let’s have CODAP compute that.
Click on the table and look for the gray circle with the plus sign. Click it to make a new attribute. Call it relief.
Give relief a formula. (Click the attribute name – relief – then, Edit Formula.) This may have some syntax you haven’t seen before, so pay attention:
count(result="no rash", group="cream") - count(result="no rash", group="placebo")
Enter that formula and verify that you get a value of 10.
Notes on the formula:
- You could use an ampersand or the word “and” in place of the commas, and it would still work.
- With the commas, you can think of them as meaning “where” or “given that.”
- Entering a formula like this is prone to typos. Copy and paste are your friends!
Of course, that value—the number of people who get relief, 10—is the same for every person. That’s because the count function applies to the entire dataset rather than to any individual case.
So we will drag it leftwards in the table, to promote it in the table hierarchy. (This step is crucial in order for the scrambler to work. If you don’t do it, the scrambler will let you know.) The result looks like this:
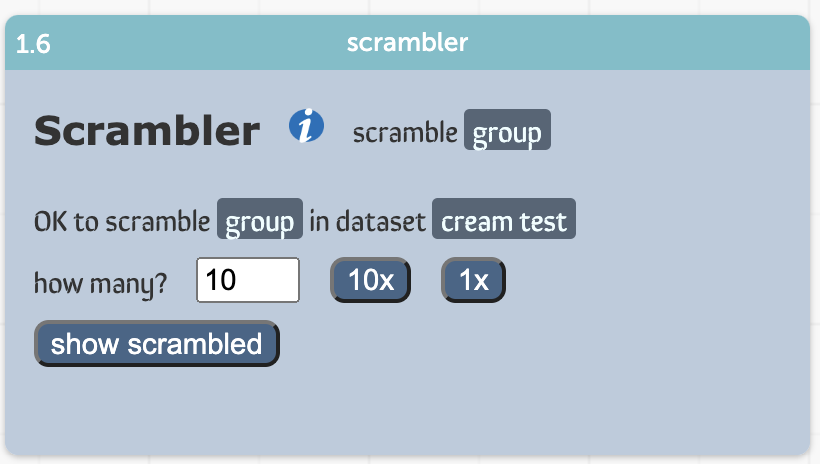
Time for the scrambler. Choose scrambler from the Plugins menu.
The scrambler appears, but it needs to know what to scramble. You could choose group or result (it doesn’t matter which!), so pick one and drag it into the scrambler. The scrambler will now look like the illustration.
It’s all ready to run.
Click the button marked 1x. This will scramble the data one time. When I did this, the table that appeared told me that relief was –4. That is, when it scrambled the group values, the difference in rashes between the two (completely random) groups was now –4. The placebo group got better results than the cream group!
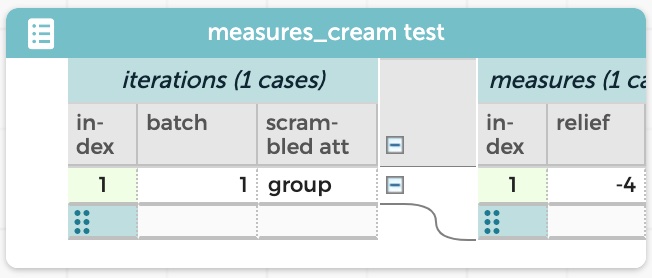
You will probably get a different value, which makes sense: the scrambling is random. On average, of course, we expect there to be zero difference between the groups, so relief will tend towards zero. But that’s only on average…
…so let’s scramble 99 more times and see what values we get. Enter 99 into the how many box and press 99x. The “measures” dataset will get 99 new values, for a total of 100. Make a graph of relief. Here is mine:
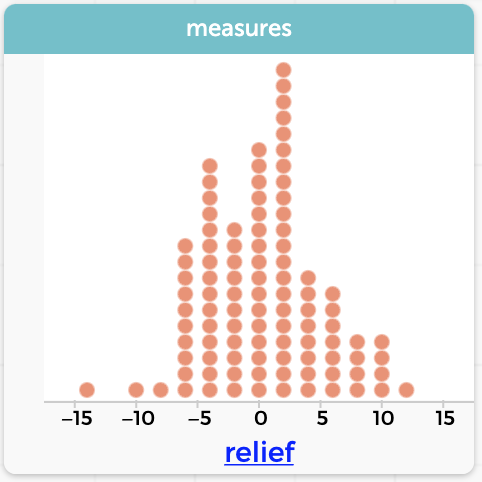 Results from 100 scrambles of our data. In 7 out of 100 trials, we got a difference of 10 or more—positive or negative—between the groups. (We’re taking a “two-sided” stance here; whether this is best is another discussion.)
Even when there was no association between group or result, in 7 out of 100 trials, I got a difference of 10 or more “no rash” people between the groups. Maybe we need more data; here’s a graph of 1,000 trials:
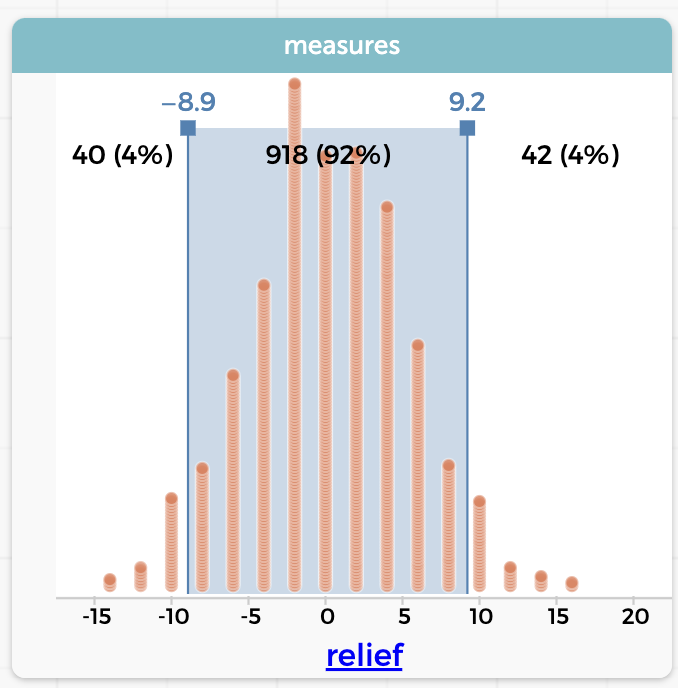
As you can see, we had 42 of 1,000 trials with relief of 10 or higher—and a similar number at the other end of the distribution. So this time, there was about an 8% chance that if there were no association, we would see a difference that extreme.
At this point, you know how to scramble data in CODAP and collect measures of group differences (a.k.a. a sampling distribution).
What you do with that information is another question. For me, this scrambling result makes me doubt my initial certainty that the cream helped 10 people with their rash. I’m no longer convinced that is true. The graph shows that a relief value of +10 is unlikely, but it is kind of plausible, even if there is no effect at all! (By the way, that 8% is an empirical P-value: 0.08, which is larger, that is, less significant, than the traditional—and outmoded—0.05.)
What could make it more convincing? Suppose we had run the test with twice as many participants? And suppose we got proportionally the same results, that is, 60 out of 100 placebos have rashes and 40 out of 100 creams have rashes. Then our value for relief would be 20. Would that make a difference in the plausibility?
Let’s try it and see. (We had to make a new fake data set with 200 cases, of course!)
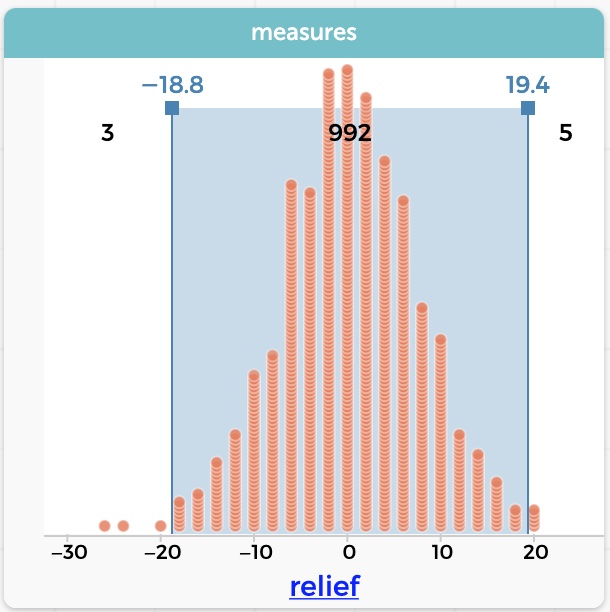
This graph shows 1,000 scrambles when the original dataset has 200 cases. Now our “test statistic,” the value of relief in our data, is 20. The distribution in the illustration shows that we had only 8 cases out of 1,000—less than 1%—where the “null” data gave us a value that large.
Notice that the results really aren’t any better. They still tell us that 20% more of the people who use the cream get relief. But it’s clearer that the result is not a fluke: it’s less plausible that what we are seeing is due to chance. We are more confident that the effect is “real.” In official stats terms, we reject the null hypothesis. And sell a lot of rash cream.
There is a lot more to be said about randomization tests. And you can learn more by clicking the blue information button in the scrambler or visiting the scrambler guide. But here are a few questions and answers:
- Can I see the scrambled data? Yes. Press the show scrambled button. You can see the most recently scrambled dataset. This is great for learning about the technique, but terrible for processing speed! So we do not show it by default. And as soon as you “get it,” close the table so it doesn’t clutter your screen.
- This was a “proportion” situation, using categorical attributes. What do you do if the data are numeric and you’re checking for, say, a difference in means? This kind of test has exactly the same logic no matter what kind of data, so you can still use the scrambler. The difference is that you would create a different measure. I would compute the actual difference of means, and collect that.
- Could you compute chi-squared instead of the difference in rashes? Yes. But you don’t need to. All that business of computing observed and expected is kind of brilliant, but you really only need that statistic in order to compute those probabilities using the chi-squared distribution. The way we did it, we didn’t have to look up a value in a table; we just counted how many “scramblings” were outside the “real” value. In my experience, students understand the distribution of actual understandable values better than they do something like X2 or t.
- What about confidence intervals? The “bootstrap” procedure is a way to do interval estimates using randomization techniques. You can find a bootstrap plugin at codap.xyz—and maybe it will soon be a CODAP built-in plugin too!
- But suppose I actually need to do a t-test? You’re in luck! We have a plugin for that too, just about ready for release. Look for a new blog post, coming soon.