Our Common Online Data Analysis Platform (CODAP) engages learners in data science practices, including data analysis and visualization. But what does “visualization” mean to blind or low-vision (BLV) learners? A new National Science Foundation-funded project is using artificial intelligence (AI) to develop and research new tools for making data exploration accessible to BLV learners.
Graphs—and the ability to easily create them through a drag-and-drop interface—are a key feature of CODAP. Both the user interface and the data representations rely on the ability of users to see what is happening. To help BLV learners create their own data representations and conceptualize graphed data, we’re building a CODAP plugin called DAVAI (Data Analysis through Voice and Artificial Intelligence).
DAVAI acts as a conduit between the learner, CODAP, and an AI assistant that can take actions for the user—bypassing the drag-and-drop interface—while also describing graphs and their underlying datasets such that users can still do their own interpretation and data exploration.
Why build a plugin?
CODAP is a complex tool that has evolved over time from origins that predate accessibility standards. While we are in the process of bringing CODAP “up to spec” for WCAG accessibility standards, we also believe that a web application can check all of the WCAG boxes and still not be accessible in the way that makes it truly usable by all. One solution we are exploring to make CODAP more accessible and usable is the development of a plugin that can act as an intermediary between the user, CODAP, and an AI component that can describe and analyze data within CODAP. With help from partners we were able to design an interface from the ground up that is more accessible to BLV users.
The APIs have it
On the surface, DAVAI is an integrated AI-based companion to CODAP that users interact with to get descriptions of datasets and graphs made by them (for example, a dot plot of mammals’ height, mass, or speed or a scatterplot of, say, sleep vs. mass).
Under the hood, the plugin forms a bridge between a large language model (LLM) and CODAP.
DAVAI takes a user’s voice or text input and sends it to an LLM via an API (application programming interface). The LLM processes the input, determines the necessary action, and returns a response to the plugin. If it has enough information to fulfill the request, the LLM responds with a message for the user. Otherwise, it instructs the plugin to call the CODAP API to gather more data (or create or modify the existing CODAP graphs). For instance, the plugin might need to ask CODAP to create a graph and then send the result from that request back to the LLM. This cycle continues until the LLM has enough information to get the user what they requested.
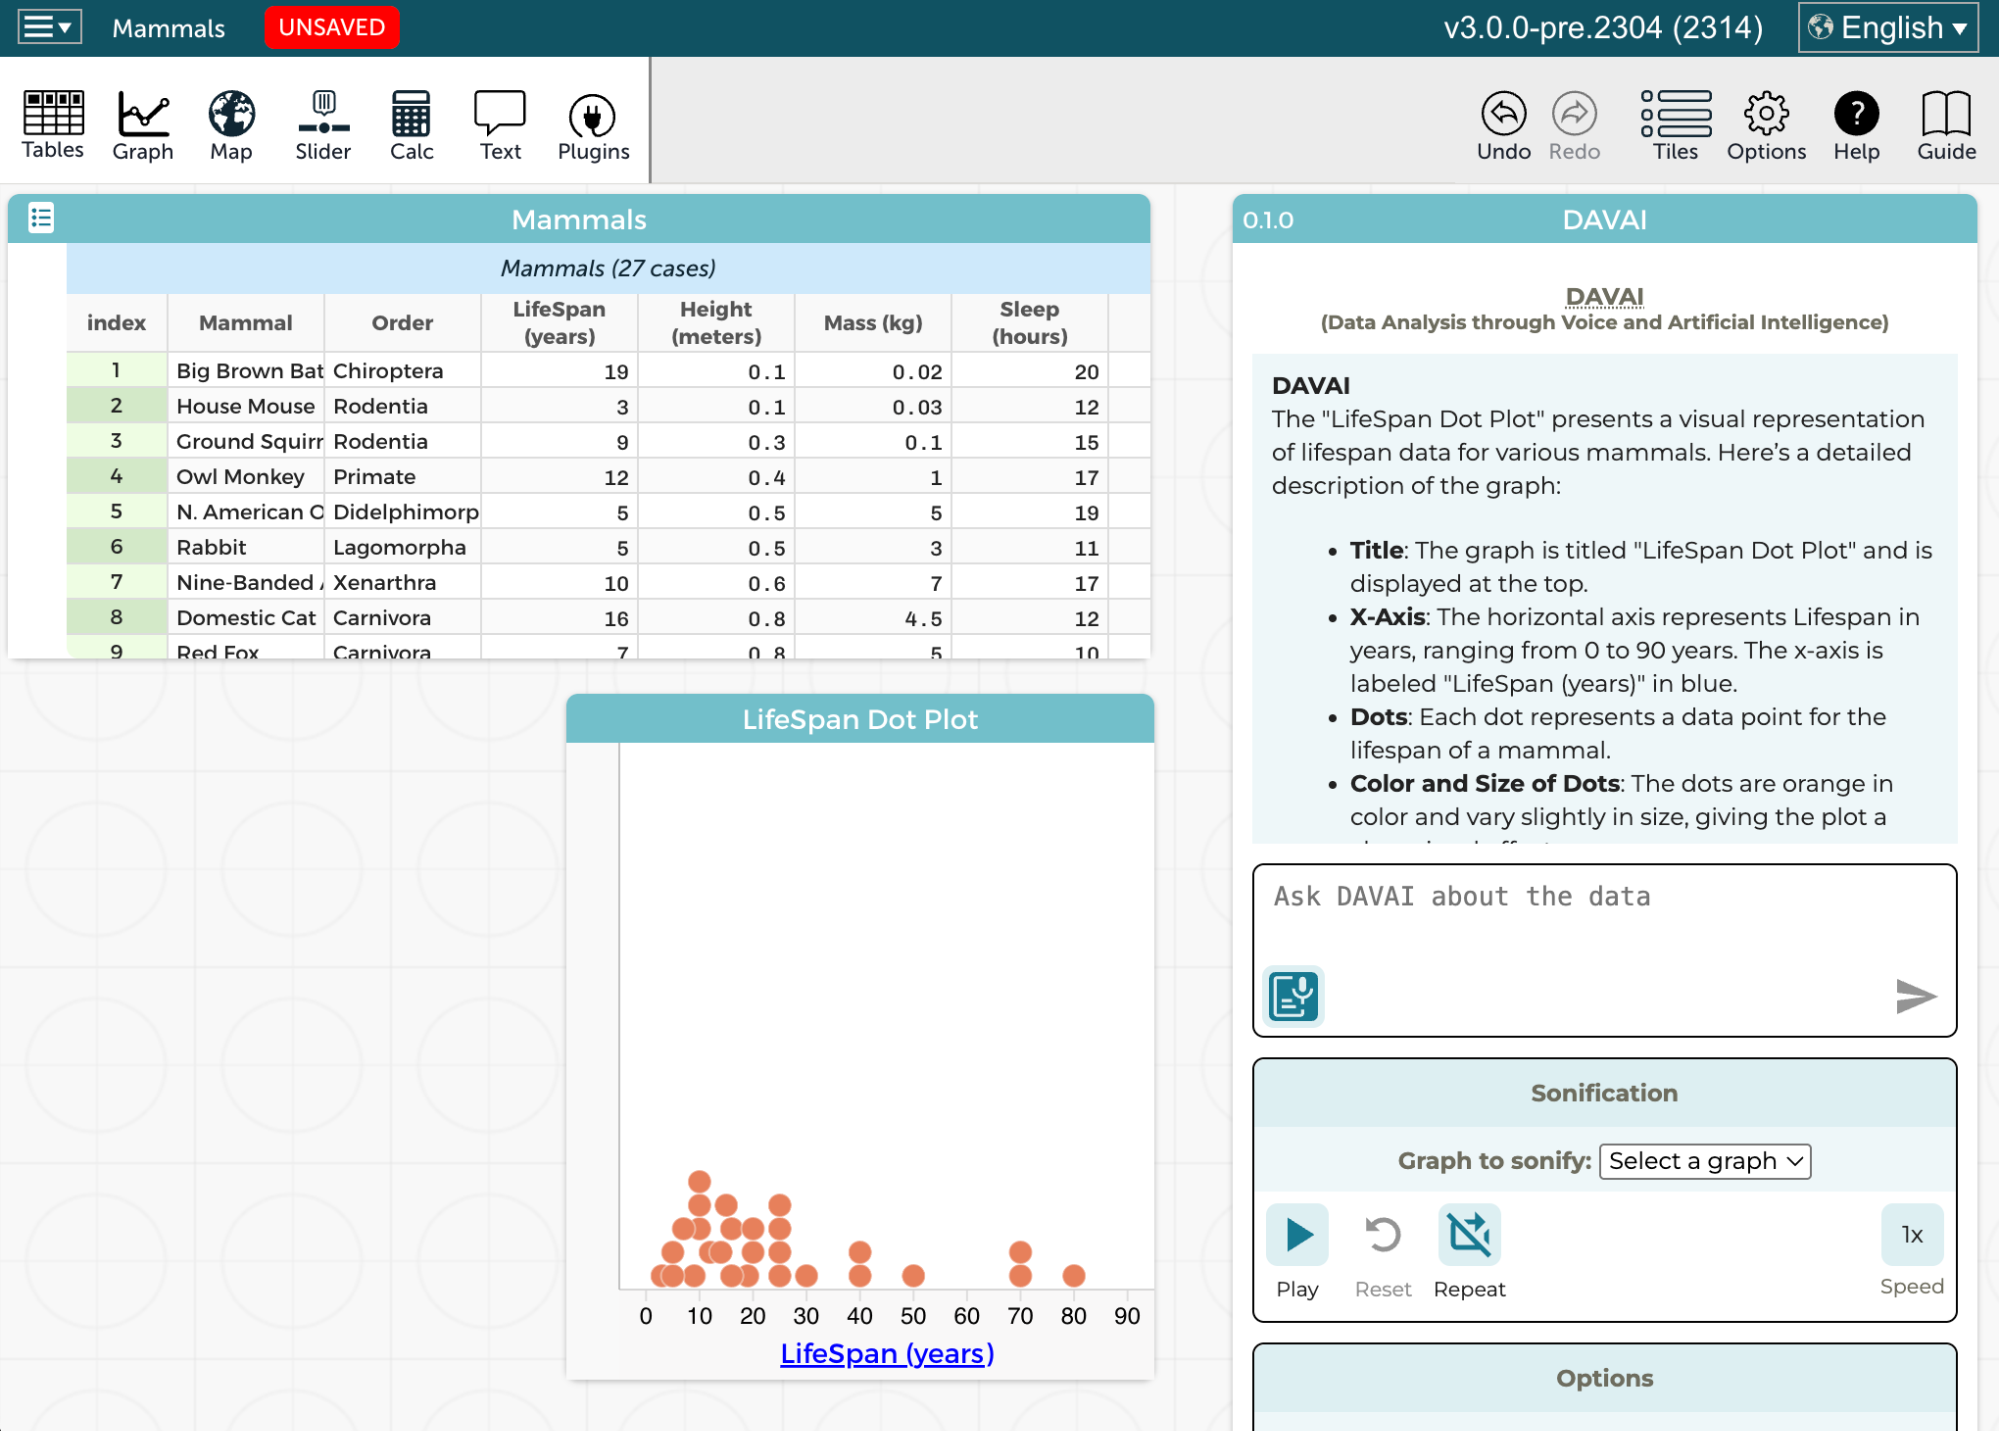
A screenshot of the DAVAI plugin in CODAP. In response to the user’s prompt about a dataset of mammals—describe the “Lifespan” graph—DAVAI provides information about that graph, including the label on the x-axis and a general overview of the shape of the data displayed on the graph.
CODAP has a robust API for plugins that allows plugins to get information about datasets and items in a CODAP document as well as create new data representations or data structures. Since we work with the CODAP plugin API all the time, hooking it up to send and receive requests to and from CODAP was the easy part. Sending and receiving requests to and from the LLM was a bit more of a challenge, but not that difficult once we learned the API.
The more interesting challenge was instructing the LLM on how to use the CODAP API. We found that by setting up a generic API tool in the assistant definition and then including the entire CODAP Plugin API in the assistant definition’s instructions, the LLM became very powerful in its ability to read and work with CODAP documents. With that simple setup, the LLM was able to assist in taking any action made possible by the CODAP API, which was a pleasant surprise.
A picture is worth a thousand words
Leveraging CODAP’s ability to export graphs as image files and the LLM’s ability to interpret images, we decided to provide images of graphs to the LLM. This way, the LLM can “see” exactly what a graph looks like in CODAP, and then describe its visual features to the user. For example, the LLM might describe the overall shape formed by the data. From this description, the user can begin to infer the relationships suggested by the data.
To make this work, we augmented the CODAP Plugin API so plugins can request graph snapshots. This allows the plugin to fetch the image data and send it to the LLM for analysis. We also updated the API documentation (and the LLM’s instructions) with this new API pattern. Now the LLM can decide when it needs to tell the plugin to get that image data for it based on what the user wants to know about a graph.
What follows is an example of how JSON is used to send and receive data between CODAP and the LLM, using DAVAI as a bridge. The lines of code under “Send” are used to send instructions to get the graph component image snapshot. The lines of code under “Receive” are an example of the data that’s received by the plugin and passed on to the LLM.
Send

{
  "action": "get",
  "resource": "dataDisplay[12345]",
}

Receive

{
  "success": true,
  "values": {
    "exportDataUri": "data:image/png;base64,iVBORw0KG… [remaining image encoding not displayed for brevity]"
  }
}
The sound of a graph
DAVAI can provide more than visual descriptions of graphs to users. It can also create sonified representations of CODAP graphs. Using the CODAP API, the plugin retrieves the relevant graph data and maps the data to pitch and time values. The plugin then uses Tone.js, a web audio framework, to play those pitches in sequence within the browser.
What follows is a short video showing sonification of a Speed vs. Height scatterplot for a set of mammals. As a vertical line sweeps across the graph a tone is emitted for each point the line encounters. The pitch of the tone is related to the y-axis value of the point (in this case the speed). The higher the value, the higher the pitch.
Sonification opens up creative possibilities for conveying information about graphs and empowering users to explore data in meaningful ways. Currently, the plugin supports the sonification of graphs with numerical data, allowing users to play, pause, restart, and adjust the playback speed of an overall graph sonification. We plan to add sonification for categorical data and allow users to explore graphs sonically at a more granular level, by stepping through and listening to specific sections of data.
Towards the future of accessible data education
Working closely with accessibility consultants Geoff Freed of Perkins Access Consulting at Perkins School for the Blind and Sina Bahram of Prime Access Consulting, our goal was to do more than simply translate visuals into words or sounds. We wanted to reimagine data exploration for blind and low-vision learners.
By combining AI, thoughtful interface design, and innovative features like sonification, DAVAI opens up rich new pathways for engaging with data—pathways that are inclusive, dynamic, and empowering. As we continue to refine and expand this work, our goal remains clear: to make data science education accessible to all learners, regardless of how they perceive the world.
One thought on “Making data exploration accessible for blind and low-vision learners using AI”
Comments are closed.
Hello! I am working on the topic of science assessments for students with severe cognitive disabilities, at the ATLAS center University of Kansas. For our research we are interested in the use of technological enhanced representations that can be adapted with reduced breadth, depth or complexity, or include accessibility features. Looking forward to learning more about your work.