We’re thrilled to announce an updated release of the Rocks & Tectonics module! This module revolutionizes the teaching of the traditional rock cycle by connecting rock formation to plate motion and the tectonic conditions under which rocks form.
The new version of the Rocks & Tectonics module incorporates new interactive feedback mechanisms designed to support students at every step of the learning process:
- Guidance on Simulation Setup: As students set up their experiments, they now receive improved prompts to ensure their configurations align with the scientific objectives. They also can see a hint that shows an ideal simulation setup.
- Real-time Data Validation: When students set up TecRock Explorer then can compare their setup to an “idealized setup,” and when they create a data table they can check data and get immediate feedback on which specific rock types still need to be collected.
- Reflective Prompts: After completing the simulation investigations, students are prompted to consider patterns in the data.
- Teacher Support: Additional tips have been added to the data collection tasks in the module to help teachers guide their students’ investigations. Teachers can also quickly scan through their students’ data tables using the real-time Class Dashboard.
TecRocks Explorer
The module includes the TecRocks Explorer simulation that enables students to investigate the relationship between the plate tectonic system and the rock formation system (Figure 1). While TecRocks Explorer is unique and amazing, it is also simulating complex Earth systems. In other words, there’s a lot happening and a lot to observe and reason about!
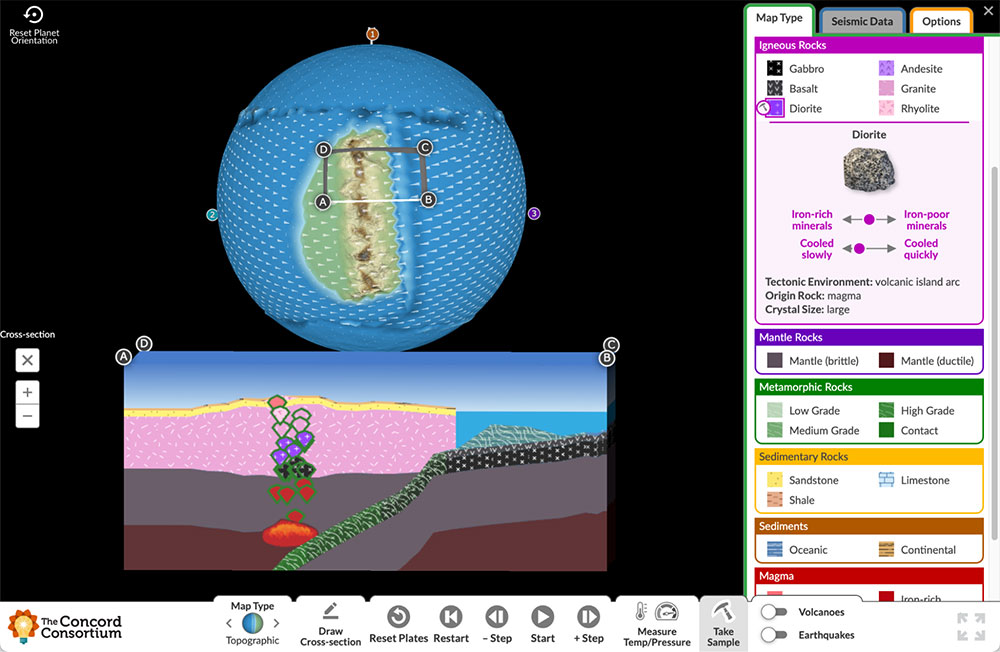
Figure 1. TecRocks Explorer. A cross-section at a convergent plate boundary shows the formation of igneous rocks below the surface. Students can take samples of a rock to reveal its properties.
New data table helps students explore the simulation
To help guide students’ use of the TecRocks Explorer, we added a new interactive tool to the simulation–a data table that allows students to stop the simulation and collect information on rocks in the cross-section. Students can click anywhere in the cross-section to add a pin and collect data on the type of rock at that location. Students can pin any number of rocks as well as other elements in the simulation, including sediments, the mantle, and even the ocean. Each pin adds a row to the data table. Students are then able to examine the properties of the element under the pin along with the cross-section, which shows the pins next to the table.
Last year, we ran a field test of the Rocks & Tectonics Module (V2) with this new feature in 13 teachers’ classrooms across the United States. Students were presented with specific tasks that asked them to collect certain types of rocks under specific conditions and in specific tectonic environments. While both teachers and students reported that the interactive nature of the simulation was helpful, many struggled with collecting data and building a data table effectively.
We conducted a thorough review of student responses and performance in regards to the data table. Our online activity system captured a snapshot of the TecRocks Explorer, the table of data that students collected, and their responses to a series of question prompts that asked students to reflect on their data. We found that identifying and interpreting patterns in rock formation proved challenging for some, especially those students who did not set up their experiment correctly.
In general, teachers reported that students were unsure of whether they were collecting the right data or interpreting their results accurately. Our analysis of students’ work corroborated the teachers’ feedback. This lack of clarity often hindered their ability to connect simulation outcomes with key concepts in geology and tectonics. Based on this information we revamped the data tool to include real-time feedback for students as they use the TecRocks Explorer simulation to collect and analyze rock formation data.
New scaffolding
First we needed to help students set up the simulation in a way that would produce the required phenomenon. To address this issue we clarified the text in the task instructions. In addition, a hint showing a snapshot of an exemplar simulation setup was added to each data table task, which students could access by clicking on a hint button.
For example, if the task asks students to examine rock formation at an ocean-continental convergent boundary, it is important that they include oceanic crust converging with continental crust. Our data analysis revealed that some students didn’t include continental crust when they set up the simulation. By including the snapshot hint, students are now prompted to recreate the planet setup to reflect the ideal starting scenario. Students can click on the hint, which will reveal a snapshot and explanatory text (Figure 2).
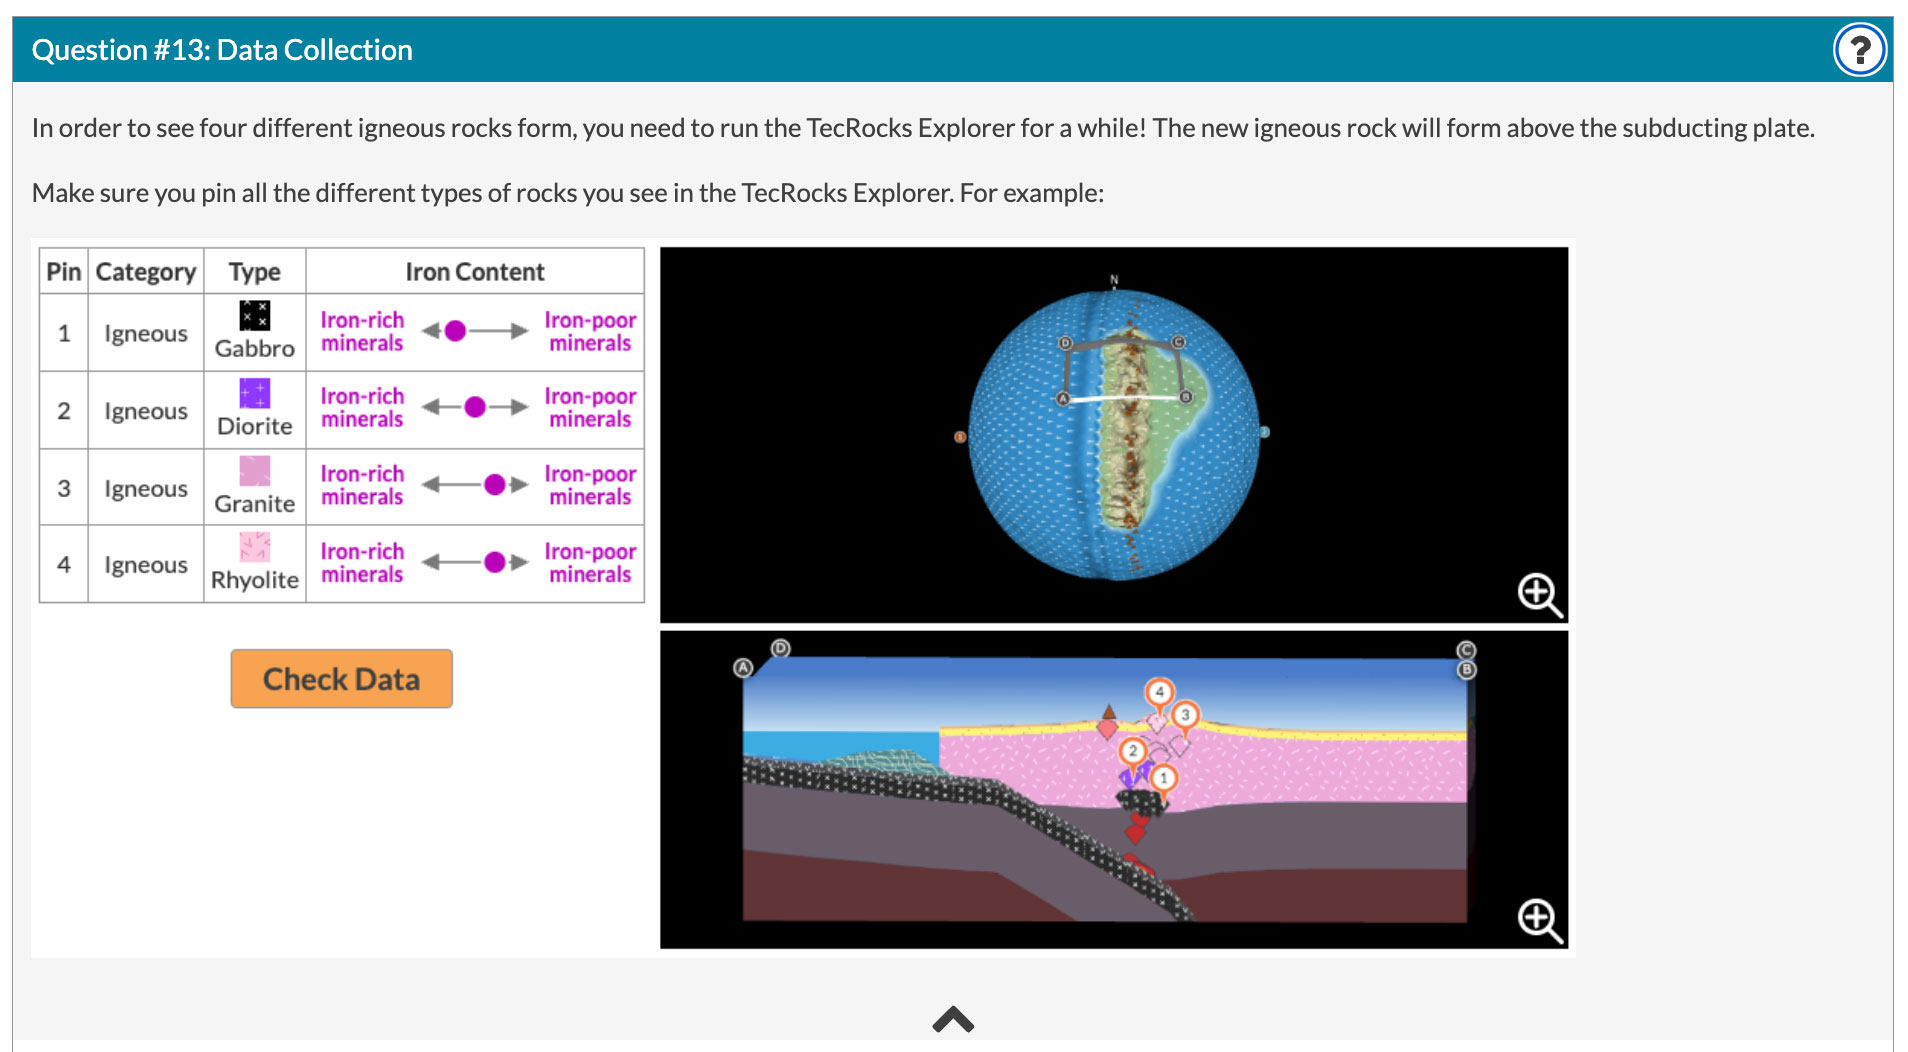
Figure 2. When students click the “?” in the upper right corner, a hint showing both text and a snapshot is displayed.
Similarly, students did not always draw a cross-section that would reveal what was going on below the surface along the convergent boundary. The snapshot hint also cues students by showing them an exemplar location of a cross-section and an example of the required simulation output. The snapshot is designed as a visual scaffold for students to compare their simulation to the targeted visual.
In the example below, students are instructed to collect data on the four different types of igneous rocks that form as magma rises from the mantle to the surface of a continent. If the student didn’t run the model long enough, they missed the formation of certain rock types as shown in the example below where only two types of rock are included. To address this, we added a “Check Data” button (Figure 3), which analyzes the student’s data table and provides feedback on which rock types were missing.
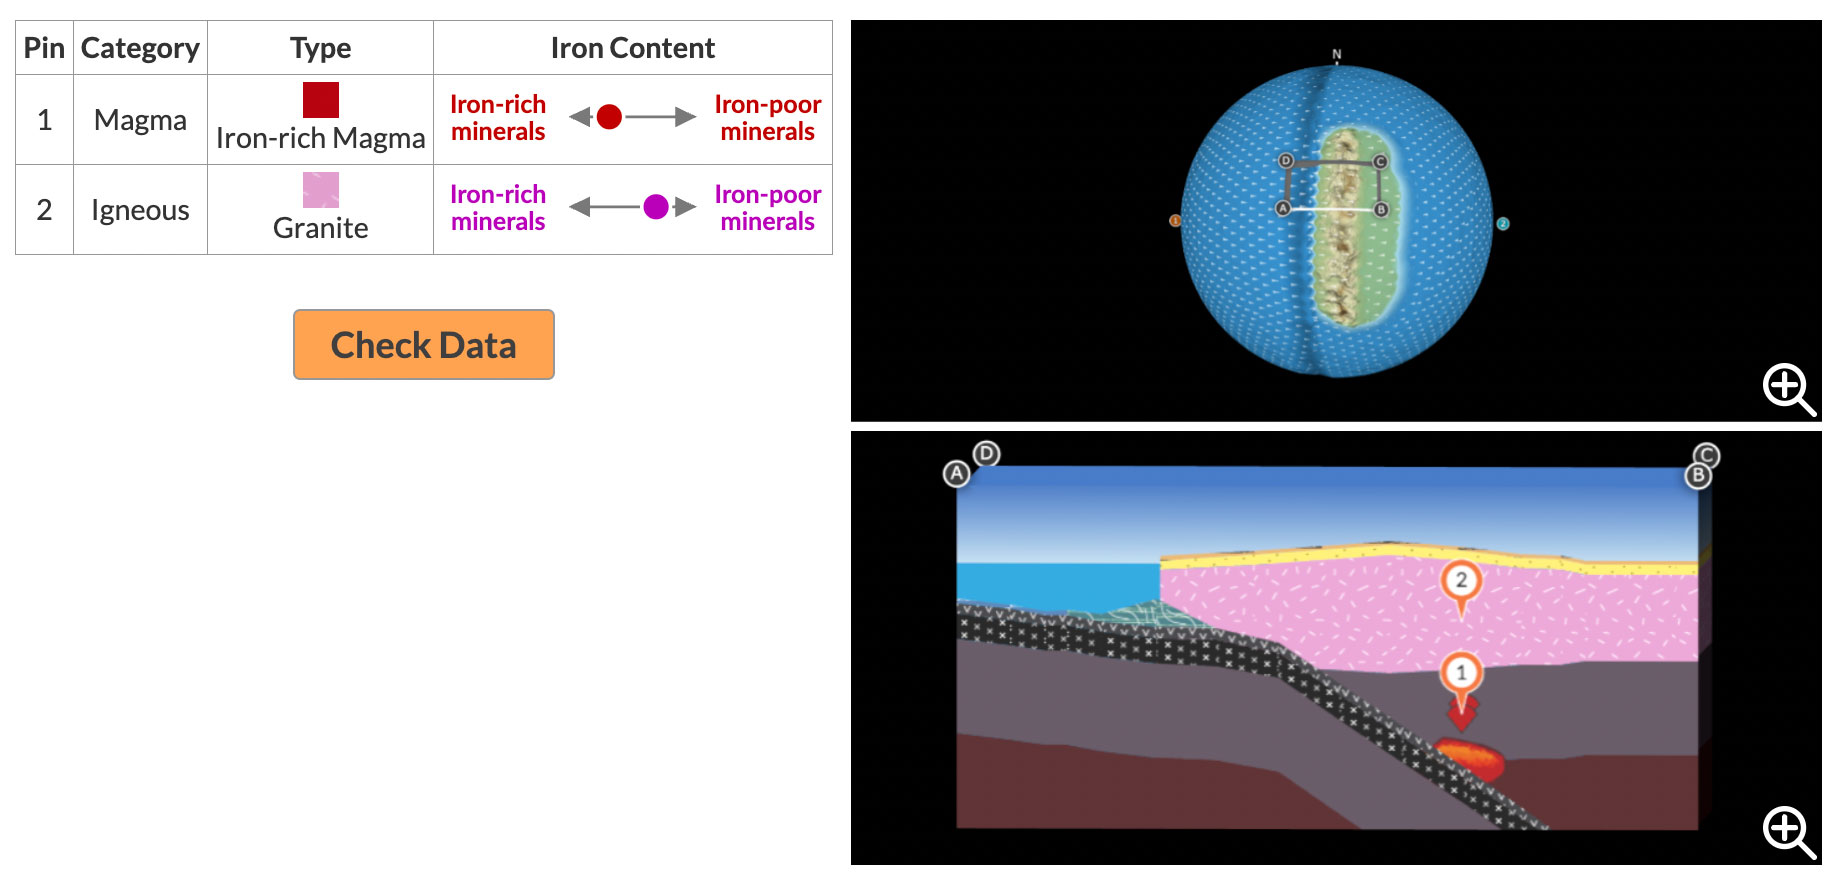
Figure 3. Data table (left), including pin, rock category and type, and iron content of the rocks.
When the button is clicked, the table is analyzed in real time and students receive feedback on their work (Figure 4).
Figure 4. Automated feedback is provided to students about the data they need to collect.
After viewing the feedback, students are now able to go back to the simulation, continue running it, and collect additional data to add to their table. When they check their data table again, they will receive confirmation that they have included the necessary rock types (Figure 5).
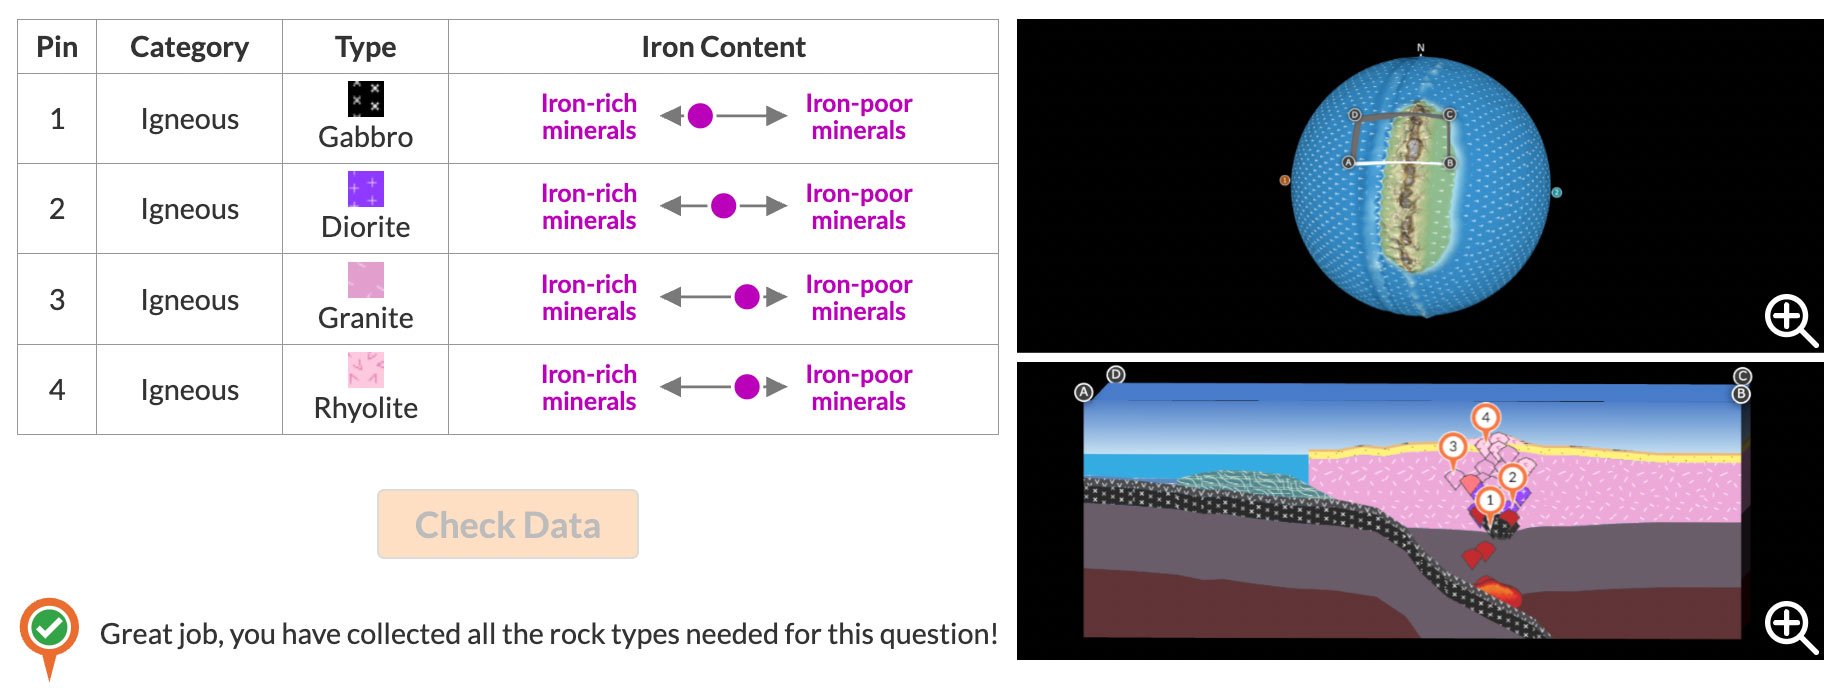
Figure 5. In this example, the student collected all four types of rock in their data table.
Once students have collected the required data, they are asked to reflect on patterns they see in the different columns and the snapshot. By organizing their observations into a table and connecting the data to the location in the simulation, students can more readily uncover key patterns in tectonic processes and rock formation. For example, in the table above, students can see the change in iron content of the rock types at different depths.
Our research has shown that when middle and high school students engage purposefully in investigations, they can reason about the connections between plate tectonics and the different types of rocks that form in these environments. This enhanced data table tool is designed to give students a boost, and to help make sure they have the necessary data for reasoning about these processes.
Visual key as a virtual mentor
With these updates, students gain a more supportive learning environment that helps them make sense of the complex simulation. The new feedback system serves as a virtual mentor, helping students:
- Develop confidence in setting up experiments and using scientific tools.
- Recognize and interpret patterns in their data more effectively.
- Connect their findings to broader geological and tectonic concepts.
- Learn through trial and error in a safe and encouraging space.
Teacher support
The Teacher Edition of the module has also been enhanced to include more tips on how to help guide students through simulation-based tasks. In addition, student work on data table tasks is now viewable on the teacher dashboard so that teachers can quickly see if students ran the simulation and collected data in a way that enables them to see patterns and connect processes and conditions in tectonic environments to the rocks that are forming in those environments.
Try it now!
You can use the updated Rocks & Tectonics Module V3, which includes teacher support materials, class dashboard, and assessments for free at learn.concord.org/geo-tecrocks. Contact us at tecrocks@concord.org if you have any questions or comments.