Shelley Olds is an Instructional Designer at the EarthScope Consortium.
Many middle and high school students learn about earthquakes by studying California since it is the most seismically active state in the contiguous United States. Students learn that there is an earthquake cycle and that the cycle that ends with an earthquake. But what happens to the land between earthquakes and how does this impact the size of the earthquake?
First, let’s talk about California. Several active faults cut through the state, including the infamous San Andreas Fault, which runs from the southern border with Mexico up past Los Angeles and right through the middle of San Francisco. The San Andreas is the dividing line between two tectonic plates, the Pacific Plate and the North American Plate. The plates are locked together for most of the length of the San Andreas fault, deforming the land as the plates try to move past each other. The land along the fault is held together at varying levels along the fault. South of LA, the two plates slide relatively easily past each other, but they experience a high level of friction near Los Angeles and San Francisco. In these areas, a large amount of land deformation builds up before there is enough energy to break them apart. Eventually, the friction between the plates is overcome by the energy stored in the deformation, causing an earthquake. The more energy built up along the fault, the more energy is released, and the larger the earthquake. This continual accumulation of deformation and periodic deformation release is called the earthquake cycle.
Now let’s talk more about California’s largest cities. As I mentioned, Los Angeles and San Francisco—together home to more than 20 million people and all of the infrastructure that comes along with supporting a population of that size—are positioned along or next to some of the more dangerous parts of the San Andreas fault. If an earthquake were to occur in those cities, millions of people and their property would be impacted by powerful ground shaking.
Seismic risk
To better inform people and help them prepare for an earthquake, scientists disseminate information about seismic risk. Estimating risk involves combining the likelihood of an earthquake occurring with the potential for damage that an earthquake could cause, including the size of the earthquake and the number of people that live in an area. Below is an example of the USGS’s seismic hazard map for the United States (Figure 1). California stands out!
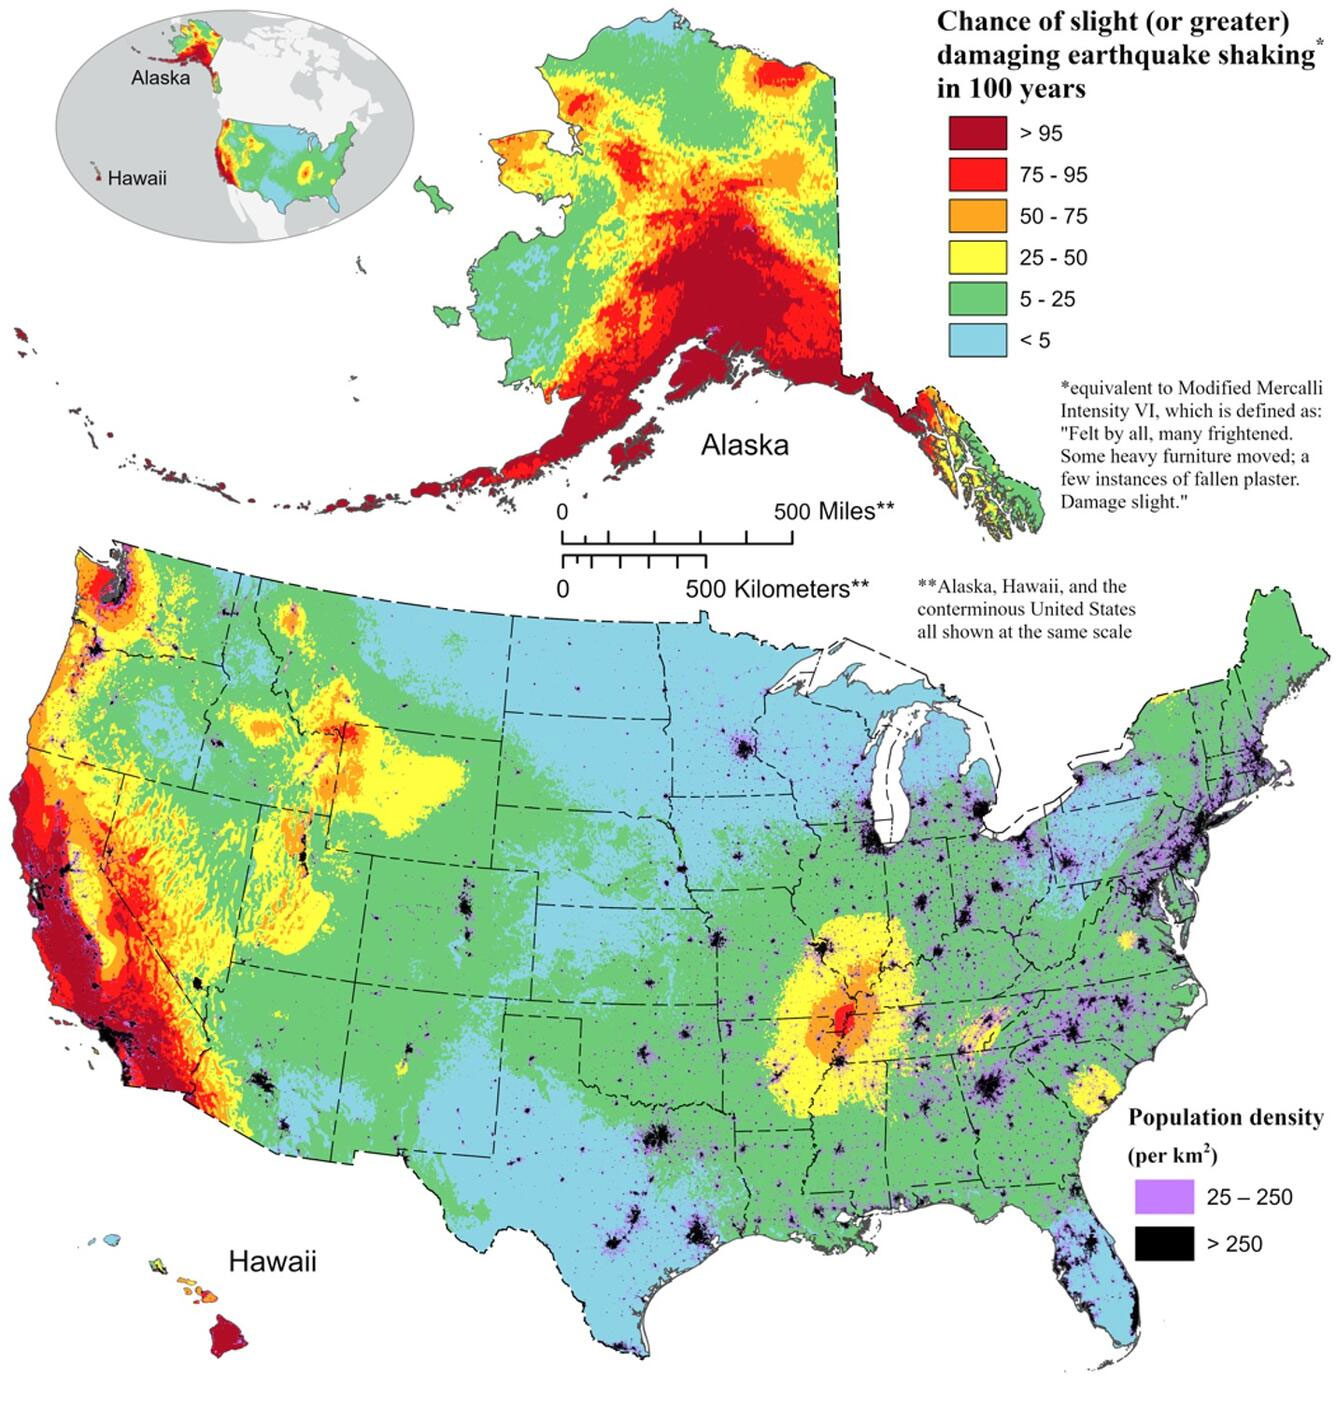
Figure 1. Long-term National Seismic Hazard Map (U.S. Geological Survey, 2019). Earthquake hazard map showing the earthquake-prone regions in the United States. Magenta indicates the areas with the highest hazard and gray indicates areas with the lowest earthquake hazard.
Throughout the western United States, scientists have installed over 1,000 Global Positioning System (GPS) instruments to measure the movement of Earth’s surface. The movement of the land is measured very precisely by GPS and other Global Navigation Satellite Systems (GNSS). GPS satellites send signals to GPS receiving stations permanently anchored into rock or deep into soil. If the ground moves, the GPS station moves with it.
Every day, these GPS stations have recorded their exact location, creating a continuous dataset of their position over time. Seismologists, geodesists, and other scientists who study earthquakes compile and analyze these large datasets to understand the movement of the Earth’s surface (Figure 2). Through daily GPS monitoring, scientists are gaining a better understanding of how the rate of plate motion deforms the land (bends and distorts the rock) across active plate boundary zones, such as along the San Andreas fault. The daily GPS data gives scientists the ability to calculate the differential speed between any two stations.
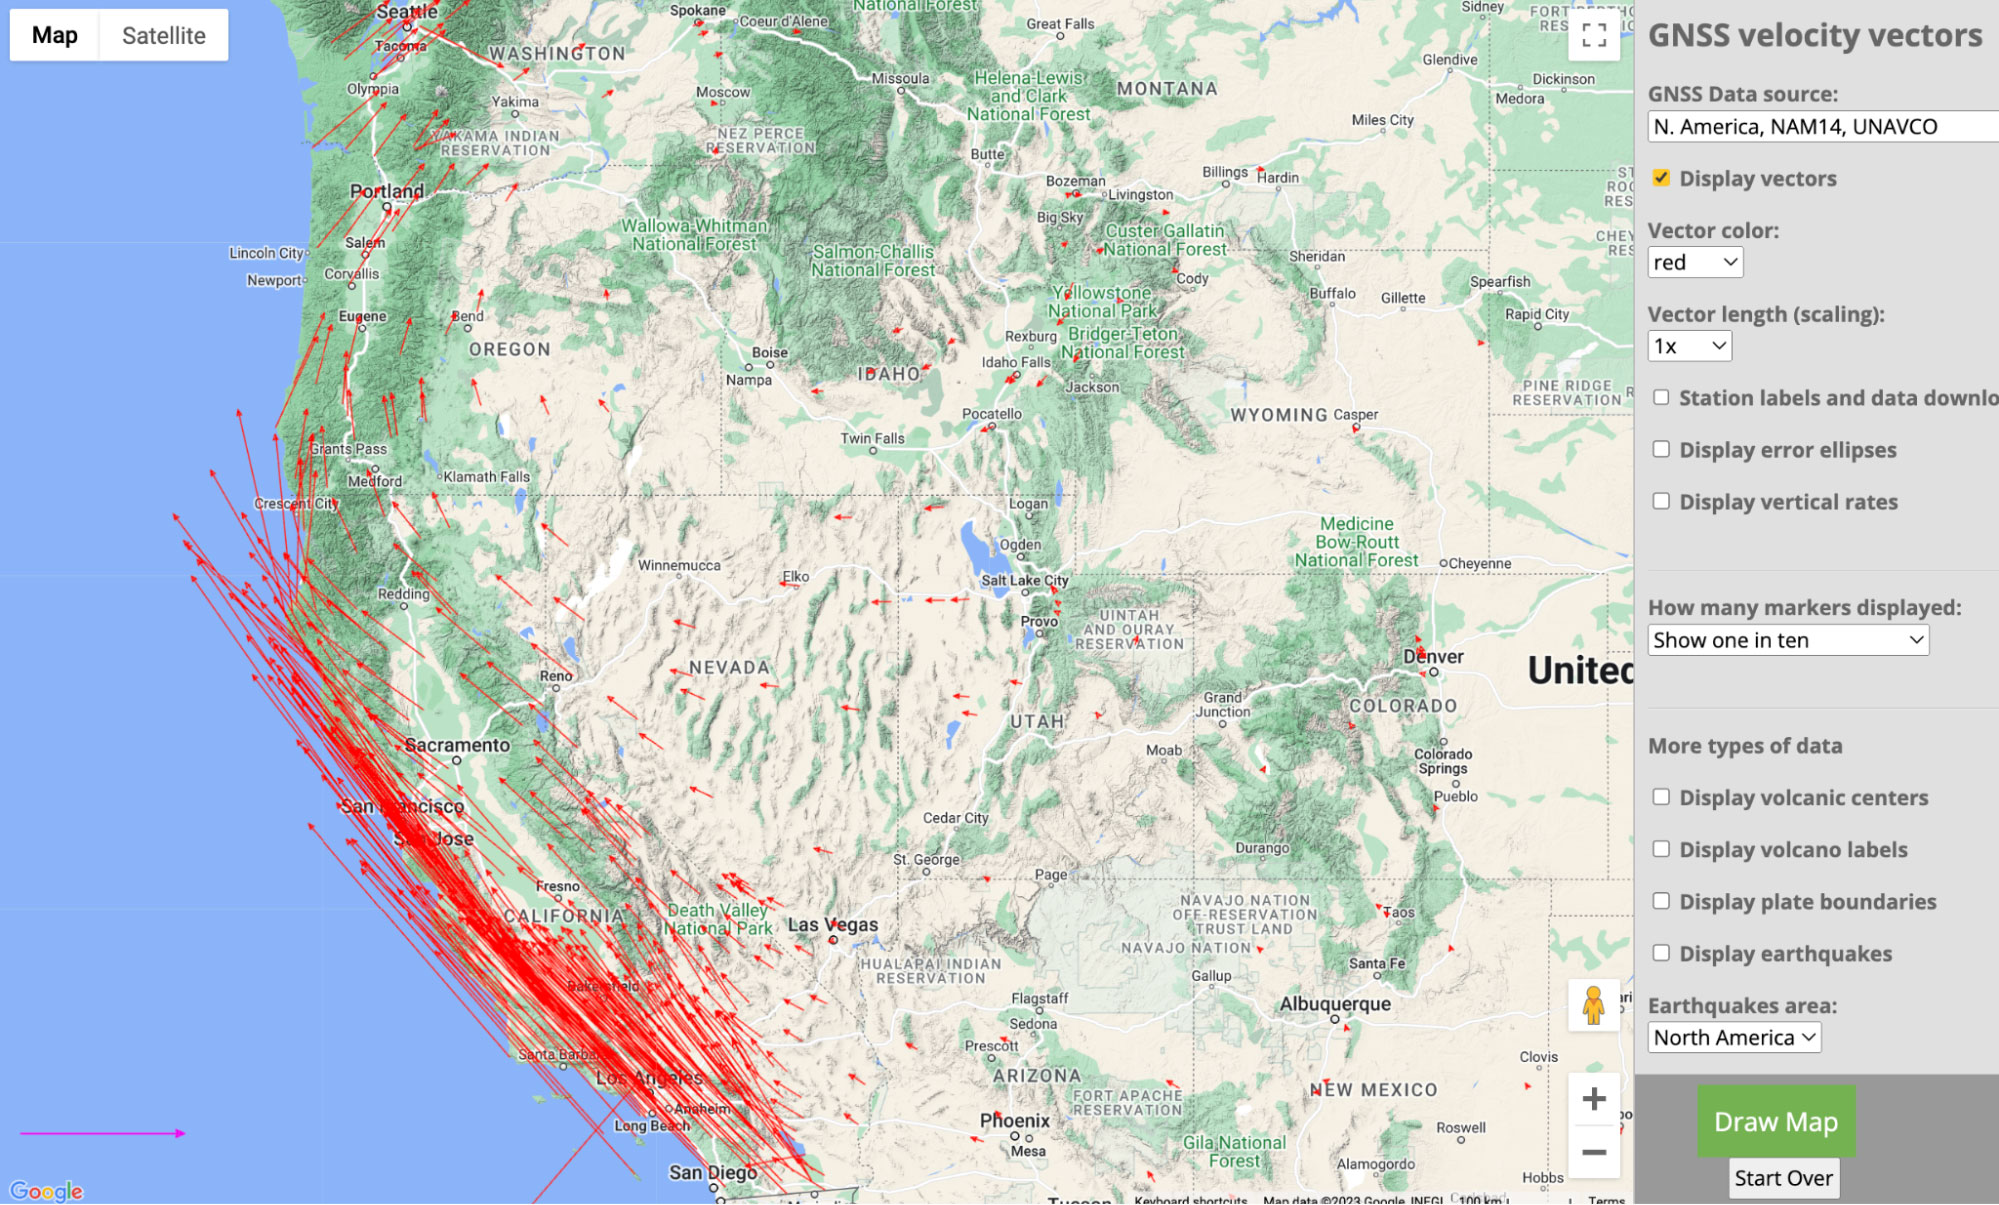 Figure 2. Velocity vectors showing ground motion as measured by GPS instruments permanently attached to the ground. The magenta vector = 25 mm/year.
Earthquake risk and impact
Secondary students can learn more deeply about the earthquake cycle, including the process, the hazards, and the impacts with the Assessing Seismic Hazards and Risks with Code learning module, developed by the National Science-Foundation funded GeoCode project. Students use block-based coding to apply analytical techniques similar to those used by scientists.
The seismic module provides students with authentic science investigations around GPS motion, land deformation, and seismic risk. The module mirrors how scientists approach problem-solving to science questions by combining block coding with big data processing and analysis that enables students to analyze data across an entire region. This approach has proven useful in simultaneously developing students’ computational thinking skills and geoscience knowledge. In the seismic module, students have the ability to:
- Run simulations easily with multiple inputs
- Create code to control output visualizations
- Create scientific visualizations of large datasets
- Analyze data and models in order to develop scientific explanations
- Design experiments to answer scientific questions
Throughout the module students use GPS data, models of plate motion, and deformation build-up maps to make forecasts about future seismic hazards throughout California. They learn why GPS data is collected and how to process it, then use code to create visualizations to make sense of it with methods similar to those used by scientists. During each activity, students build content knowledge along with coding and computational thinking skills to figure out how to visualize the data, using the visualizations to communicate the implications of the data and to consider future hazards and risks indicated by the data.
The module includes five activities and takes students approximately five 45-minute class periods to complete (Figure 3). Optional instruction before each activity lengthens the module accordingly. As students work through the module’s five activities they try to answer the framing question: “Why do you think some earthquakes cause minor impacts and others cause severe damage?”
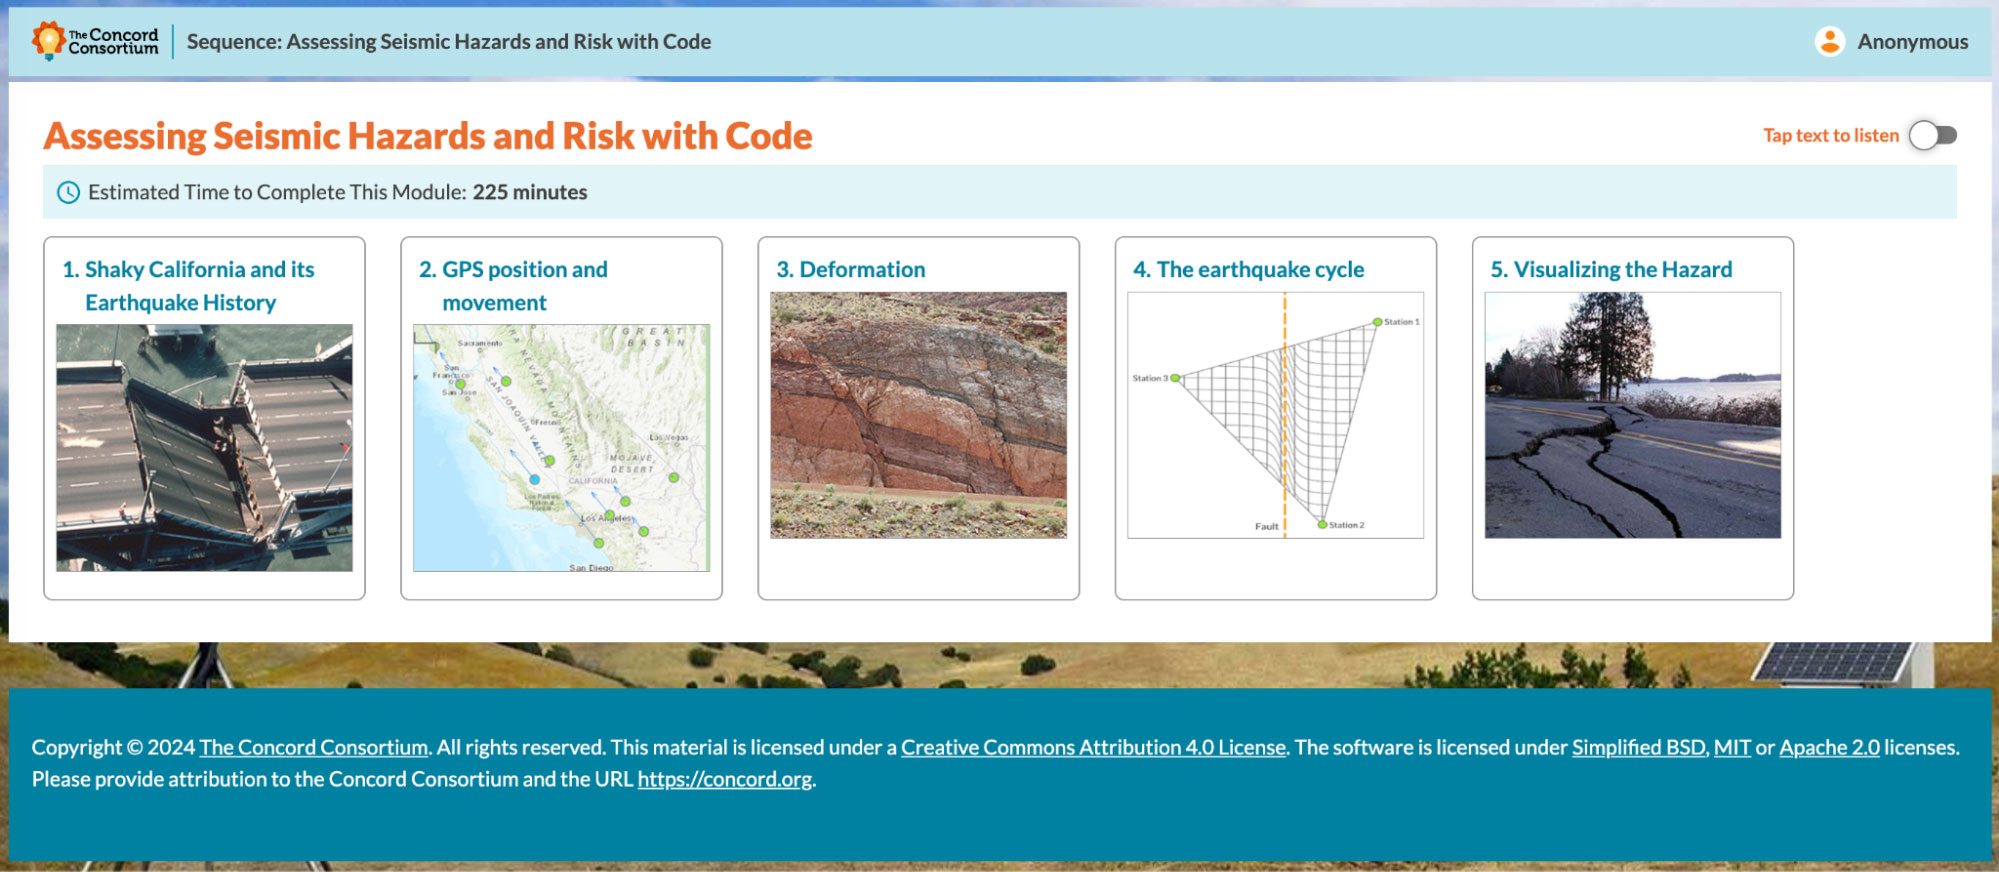
Figure 3. The Seismic Module Table of Contents
Using code to conduct investigations
Throughout the module, students use the coding and visualization workspace called the GeoCoder to explore science concepts using block-based code (Figure 4). The programming workspace consists of a menu section that includes code blocks and an area to assemble the code blocks together. By using block code, students avoid creating syntax errors from mistyped programming terms. Students have the ability to run all of the code or to step through the code block by block. The visualization area on the right-hand portion of the GeoCoder is also interactive, displaying the results of the code as map visualizations, graphs, and model simulations of deformation.
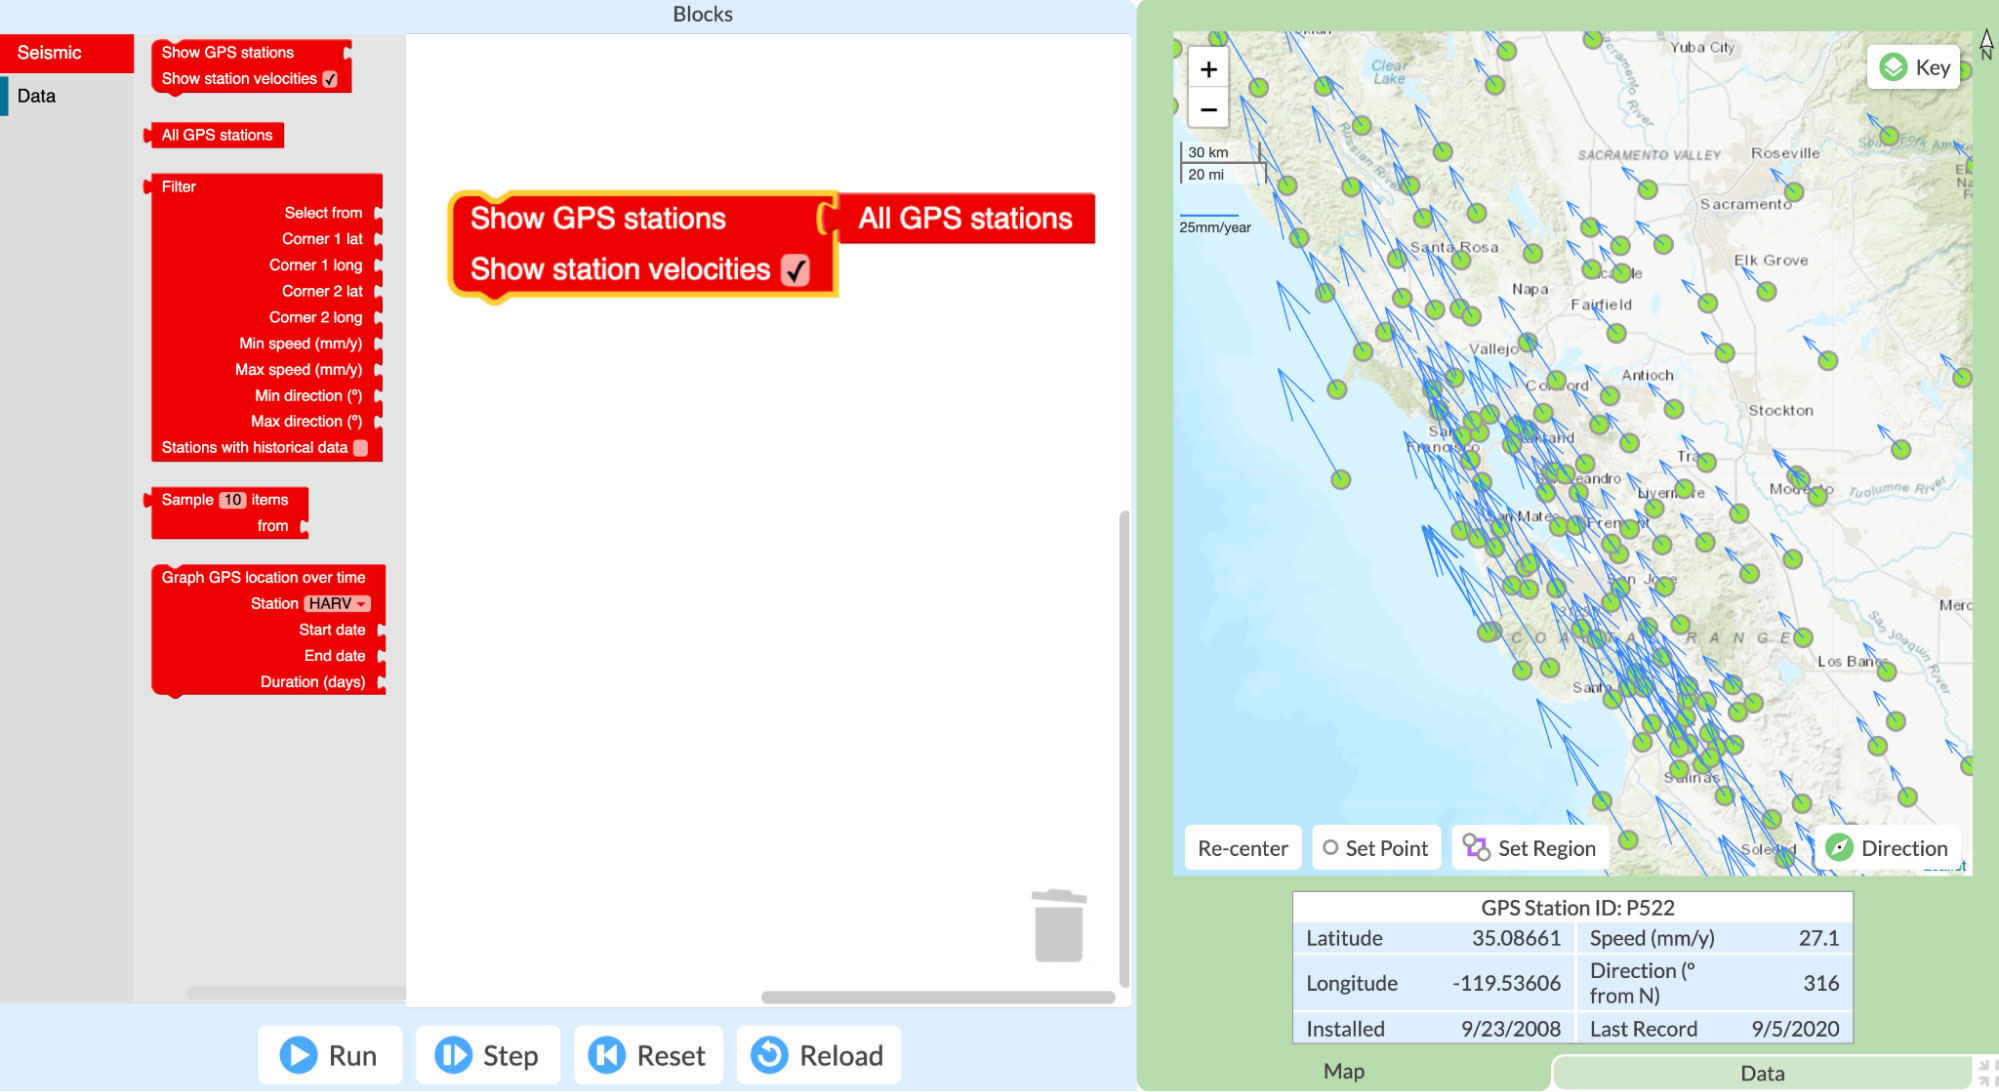
Figure 4. The GeoCoder. Code blocks click together to create programs that students run to create visualizations. In this image, students plot the locations and their velocities of the GPS stations in Central California
For example, in Activity 2, students use the code blocks to plot GPS velocities on the map of California to identify patterns in the speed and direction of the land motion. They discover that while all the motion is moving to the northwest, the land to the East is moving much slower than the land to the west near the Pacific Ocean. While this data visualization is interesting, the module helps make this differential movement more concrete by having students use code to explore the Deformation Simulation (Figure 5). Using block code, students can set the speed of the two plates, the friction level between the plates, and the amount of time, in simulated years, to run the simulation.
When the students run the code, the simulation runs based on the input variables they chose. The movement of the GPS stations, the bending of the lines, and the deformation of the grid squares help students consider how the land changes shape as it moves. By observing that the yellow highlighted grid squares closest to the fault bend and elongate, students are building a mental model of how the land surface deforms. Likewise, they notice that the squares further away from the fault line deform less (Figure 5, top). Building on this concept, students add additional blocks to simulate the earthquake cycle (Figure 5, bottom).
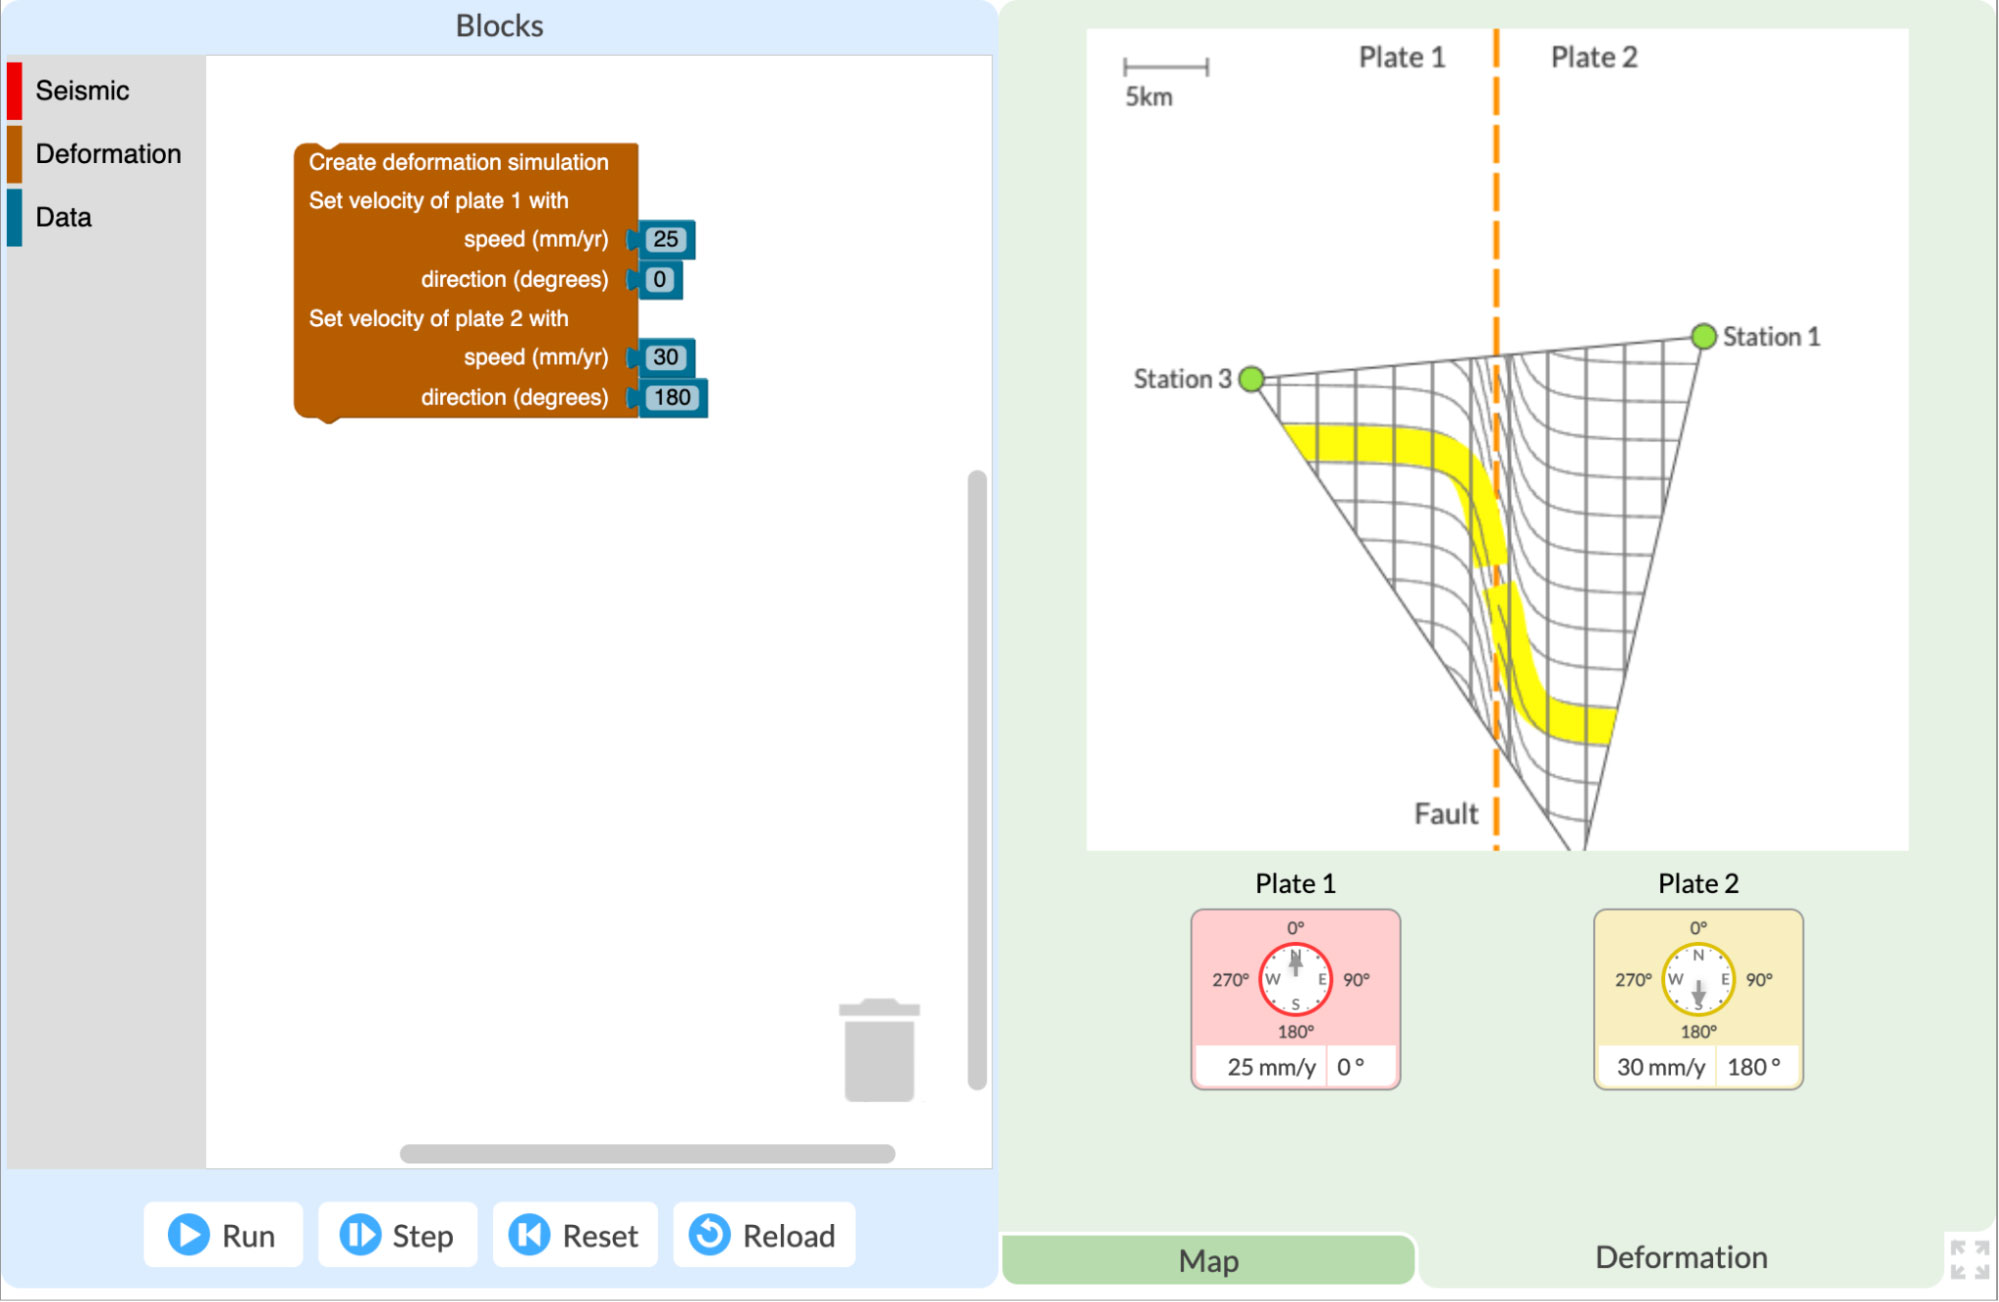
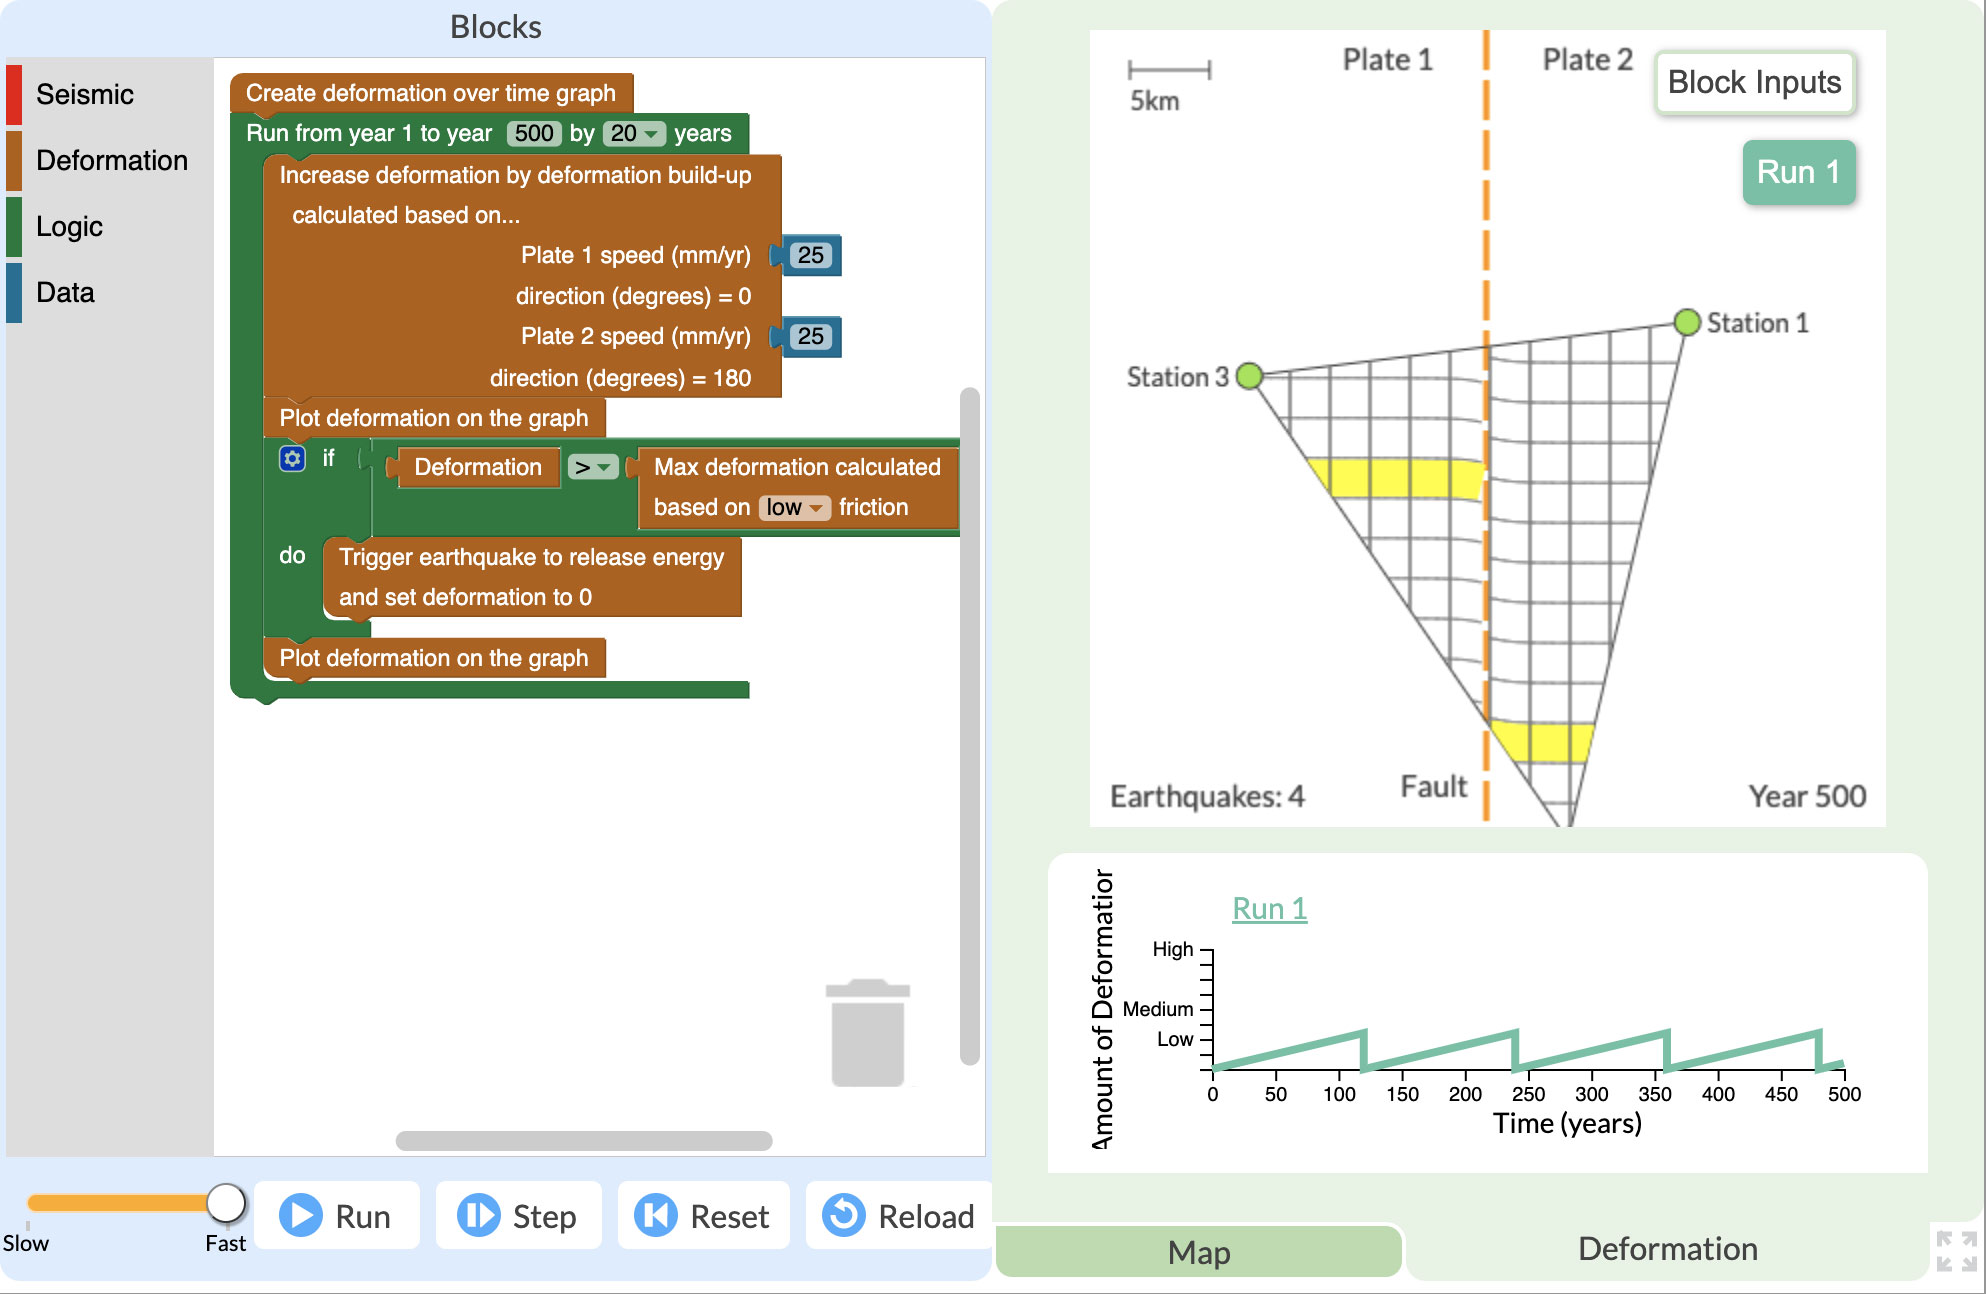
Figure 5. Deformation Simulation illustrating how the land changes shape as the plates move (top); how land shifts after an earthquake occurs (bottom).
At the end of the module, students are asked to apply what they learned and explore the potential risk this land movement might cause for people living near the faults based on population density. Pulling all of the data together, they make a risk assessment identifying the locations at the most risk of experiencing severe impacts from an earthquake.
Classroom testing and support
The module has gone through multiple rounds of classroom testing. We found significant gains in students’ computational reasoning and seismic content knowledge. Since the module’s release in 2021, 3,299 students in 137 classrooms have completed the module, including the field test classrooms.
As a result of classroom testing and observations, an extensive teacher guide and other supports have been developed to help teachers feel comfortable implementing this module. The Teacher Edition features:
- Exemplars of answers and code
- Teacher tips and discussion points
- More in-depth science content
- Theory and background of the module
Additional resources include a class dashboard guide to learn how to track student progress and performance in real time, a quick glance cheat sheet of the coding segments, learning goals, and alignments to the Next Generation Science Standards (NGSS) and Computer Science (CS) Standards.
Why understanding geohazards is important
With nearly half of the population of the United States and territories exposed to potentially damaging ground shaking from earthquakes, chances are likely that you or your students will live, work, or travel through an earthquake-prone region. While the module focuses on earthquakes in California, students develop a deeper understanding of the earthquake cycle and the connection between earthquakes, fault friction, and deformation anywhere they may occur. They not only learn about the geohazard-filled world we live in, they also have the critical opportunity to engage in authentic science explorations integrating GPS data, science, and computational practices as they consider future career paths in these exciting fields.
Want to learn more?
The following supplemental resources support the module.
- EarthScope Learning Activities in the Teaching Geodesy Collection and in the In-Class Collection Geodesy Tools for Societal Issues Collection (College introductory and majors)
- GPS, Strain, and Earthquakes Module
- ShakeAlert Earthquake Early Warning Education Materials Collection
- USGS Earthquake Map: Latest earthquakes 2.6M+ worldwide
* GPS is the United States Global Positioning System and is part of the Global Navigation Satellite System (GNSS). GNSS is the international collection of satellite positioning systems. The GPS stations referenced in this article are part of the Network of the Americas (NOTA), a component of the National Science Foundation’s Geodetic Facility for the Advancement of Geoscience, which is operated by EarthScope Consortium.