Integrating computational thinking into core science content and practices is a major goal of our InSPECT project, which is developing hands-on high school biology investigations using simple electronic sensors with Internet of Things (IoT) connectivity—a far cry from the simple germination experiments students usually encounter.
An article in the Fall 2017 Concord Consortium newsletter (“Science Thinking for Tomorrow Today”) describes the overall InSPECT project. Let’s take a closer look at a unique and powerful component of the project: virtual programming using a dataflow diagram.
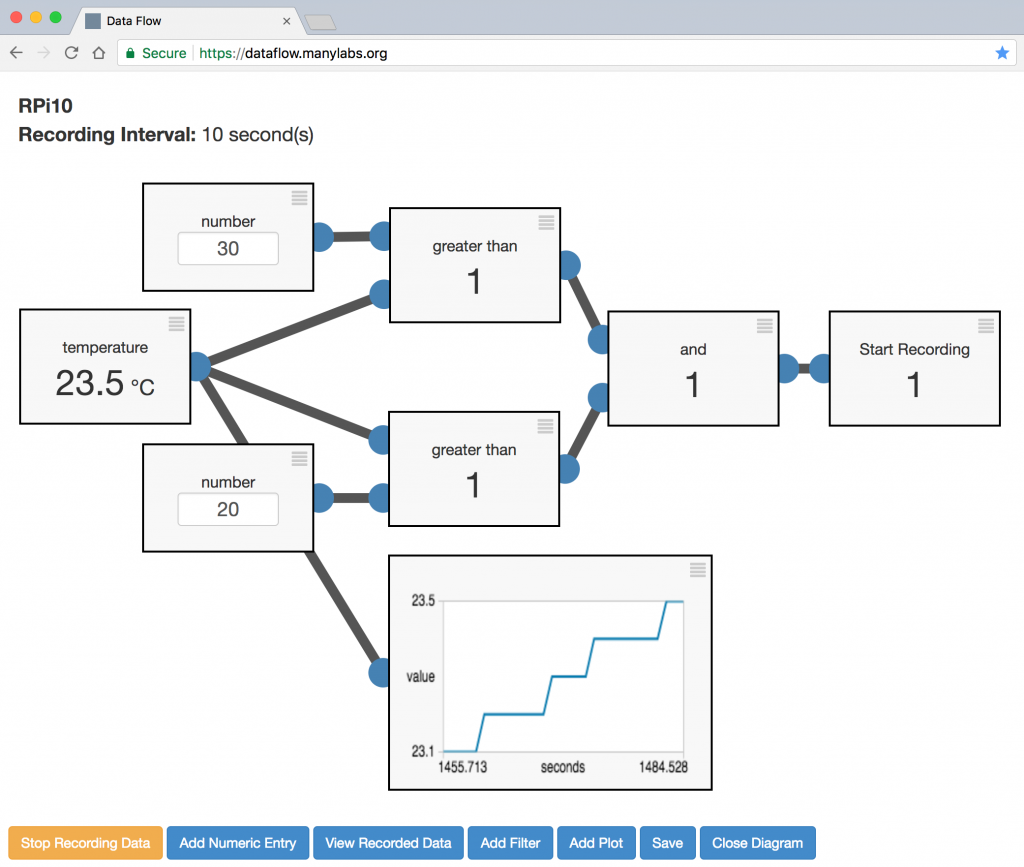
The Dataflow interface enables students to do virtual programming within the browser-based interface.
Dataflow diagrams have been around since the 1970s. They’re a visual model of the “flow” of data through a system. InSPECT has created a diagramming environment called Dataflow, the first version of which was developed in partnership with Peter Sand at Manylabs, that is much more than boxes and arrows on a page; components come alive when wirelessly synced to sensors, whose numerical data are displayed on the screen in real time as it’s recorded.
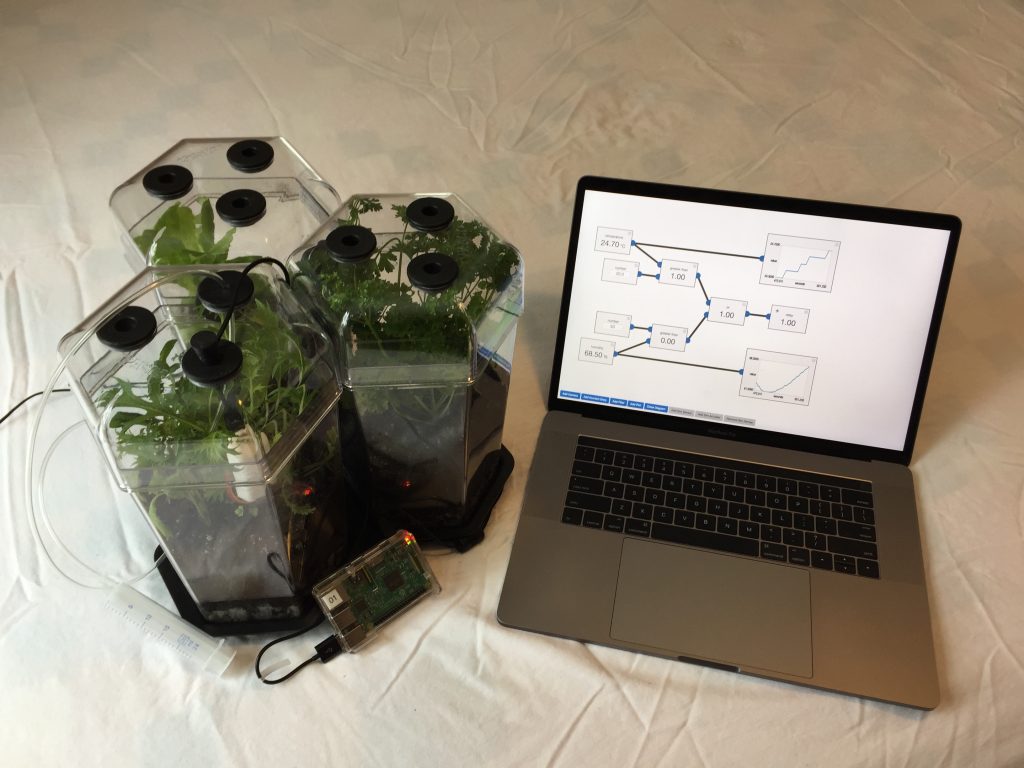
An eco-column activity includes sensors plugged into a Raspberry Pi computer. Dataflow automates data collection and initiates actions, such as raising or lowering temperature.
InSPECT is piloting an eco-column activity that includes electronic sensors plugged into a low-cost Raspberry Pi computer the size of a credit card. The sensors collect data about conditions inside the eco-column chambers, such as humidity and oxygen levels, sending it wirelessly over the Internet to Dataflow, which can automate data collection 24 hours a day, uninterrupted and unattended.
With the addition of actuators, Dataflow also can be programmed to create actions based on the sensor data. Students control the real-world actuators by defining variables and setting up conditionals that are entered directly into Dataflow’s simple, visual interface, which can run in any browser on a Mac or PC platform. For example, students can program a Dataflow diagram to adjust the current to a Peltier cooler in order to tweak the temperature of an eco-chamber when the sensor reading becomes too low or too high.
Finally, students can visualize, analyze, and interpret their data by exporting it to one of Concord Consortium’s most popular tools, CODAP (Common Online Data Analysis Platform), a free web-based environment for data analysis. Dataflow can be embedded directly into CODAP.
The use of sensor technology is still new to many biology classes, but our early research is based on the idea that when students collect data in real time, they make a powerful connection to the concepts they are studying. Using Dataflow, students not only learn to design the experiment and control the variables, they come to understand dynamic ecological systems.
The InSPECT project is currently recruiting biology teachers for our fall 2018 and spring 2019 studies. Our goal is to explore how to support integrated science practices and computational thinking in biology. We have several labs to select from involving photosynthesis, respiration, seed germination, and/or plant growth in chambers that can be from three classes to four weeks long. If you’re interested, contact us at inspect@concord.org.