Tim Erickson is an educator focusing on mathematics, physics, and data science; a consultant on several data science projects; and the author of Awash in Data.
Not long ago, I wrote a blog post about using the scrambler to do randomization-based inference. In that post, I suggested that we could also do traditional inference in CODAP—the usual stuff of an intro stats class, such as t-tests and X2. That’s what we will talk about here.
As is often the case, that power comes to you in the form of a CODAP plugin. This one is called testimate, a bit of software that extends CODAP’s functionality while taking advantage of its native powers of computation and visualization.
Here’s the basic pattern for using testimate:
- Get the data you want to study.
- Choose testimate from the Plugins menu.
- Drag attributes from your data table onto the appropriate spots in testimate.
- Choose what test or estimate you want to perform from the menu.
Let’s do an example using the same data we used in the scrambler post. We have fake data from a test of a rash cream that seems to show that the cream helps some of the people who use it. We want to know if the data are strong enough to justify a claim that the cream works.
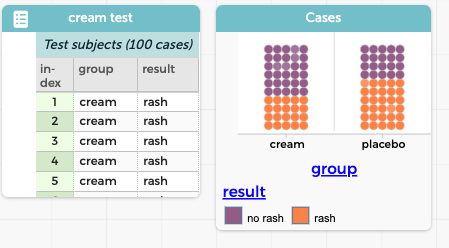
We begin with the data already in our document, as shown in the illustration above. You can see that we have two attributes: result, which has two values, rash and no rash (one day after treatment); and group, which is either cream or placebo. Each group has 50 people, but the cream group has 30 no rash (yay!) while placebo has only 20.
If you want to follow along, here is a CODAP document with the data we’ll use.
- The first step is to choose testimate from the Plugins menu. A nearly blank plugin appears with a box on the left reading “drop attribute here.”
- Generally, you’ll want to put the “outcome” attribute in that box, and in our situation, that’s result. When we drop result into that box—just drag the table header called “result” to the “drop attribute here” box—this is what we see:
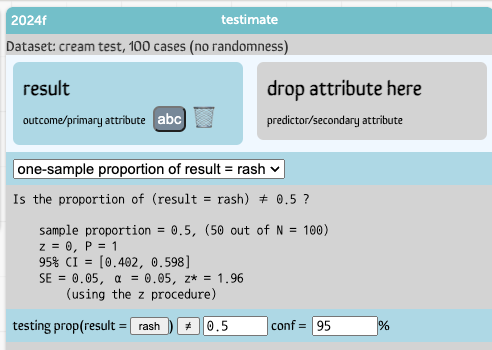
This is correct, but not yet useful. (Think about why what testimate displays is correct!) We need to tell testimate to compare proportions across the two groups!
- Now, drag group from the table and drop it into the right-hand “drop attribute here” box. There is no immediate change in the test results—because we’re still doing a one-sample test of proportion.
- Click the menu (the white box where you see currently see one-sample proportion of result = rash) to see what tests are available
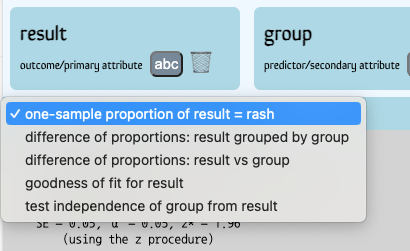
Oh! There are five possible tests we could run when we are using one or two categorical variables.
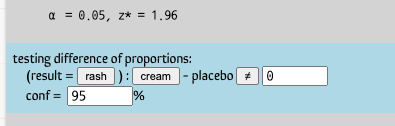
- Choose difference of proportions: result grouped by group. Now we see the test results we’re looking for. If we open up the “Difference of proportions procedure” section by clicking on the disclosure triangle, we see this:
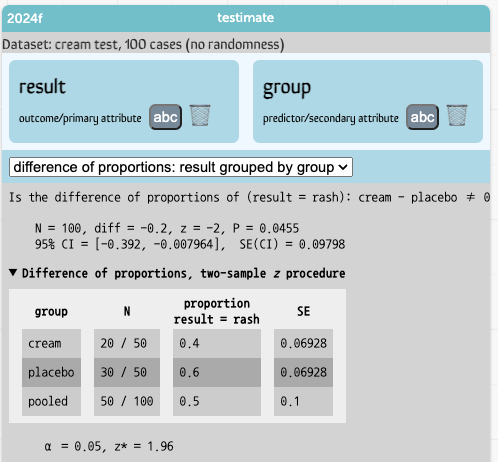
The astute reader might notice that the proportions we’re looking at seem backwards. This test is using the proportion of people who still have a rash rather than the ones who have no rash! That’s why the difference is –0.2 instead of +0.2.
Looking farther down in testimate, you can see a blue “configuration” strip that looks like this:
It tells us that a “success” (in probability-speak) is result = rash.
- Click the rash button. Now a success is no rash. The entire test reverses!
- See what happens if you click the cream button, and figure out why that is!
Other tests
With that quick example, you can probably figure out how to do most tests that you might want to do. What is possible depends on whether the attributes in the two boxes are numeric or categorical.
Here is the current (May 2024) table of what can happen where:
| numeric on left (outcome) |
categorical on left (outcome) |
|
|---|---|---|
| nothing on the right | test mean (t) | test proportion (z) test proportion (binomial) goodness of fit (X2) |
| numeric on the right (predictor) | difference of means (t, two sample) paired difference (t) linear regression correlation |
logistic regression |
| categorical on the right (predictor) | difference of means (t, grouped) one-way ANOVA (F) |
difference of proportions (z) difference of proportions (grouped) independence (X2) |
But what’s really cool is…
Sure, you can do a statistical test and have the computer do the calculations for you. But that doesn’t necessarily help you understand what the test means, or how the many numbers in the testimate display behave.
That’s where the very bottom part of testimate comes in.
Let’s continue with our example, and look at the confidence interval that appears.
- Way down at the bottom of testimate, open the emit test results in CODAP disclosure triangle, then press the emit these results button.
A new table appears, called tests and estimates. It contains most of the numbers that appear in the display. In particular, way over on the right, you can find the confidence level (95) and the minimum and maximum of the CI. (If you like, use the Choosy plugin to hide some of the other attributes so that these are easier to get to!)
The table lets us remember our results if we do tests in different ways. We’re going to change the confidence level and see what that does to the CI.
- In the blue “configuration” strip, change the confidence (conf) level to 96%. The CI changes.
- Press emit these results again. You get a new case in the new tests and estimates table.
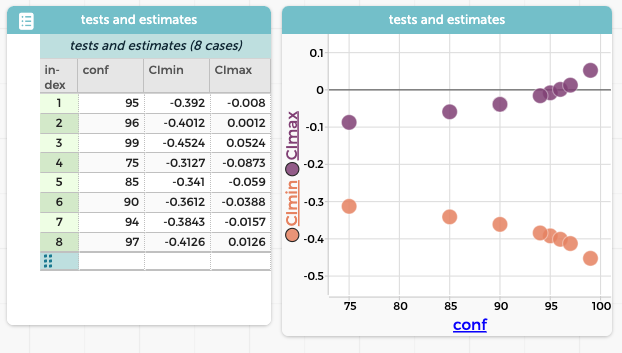
- These are now data in a CODAP table! Make a graph with conf on the horizontal axis and CImin on the vertical.
- Add additional data with confidence levels ranging from, oh, say 75% to 99%. The graph updates. See if you can understand why it goes the direction it does.
- Now drag CImax over the graph and drop it on the plus-sign above the vertical axis (so you’re plotting both CImin and CImax on the same axis). You will see the confidence-interval trumpet that shows how the CI expands as you increase the confidence level.
This kind of activity opens up many interesting possibilities. We can create data out of statistical calculations, and use that data to explore how the tests and estimates behave. Here are a couple of examples:
Making the null true
We made a table of 30 values of X using the formula randomNormal(). That is, we sampled from a standard normal distribution, which of course has a zero mean. Then we did a t-test to see if the mean was different from zero.
Since we used a random-number formula, testimate gives us additional controls at the bottom:
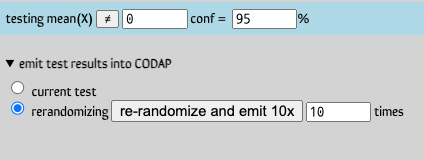
We changed the 10 to 1000 and re-randomized 1000 times, with testimate recording the test results.
What do you think the distribution of P-values looked like?
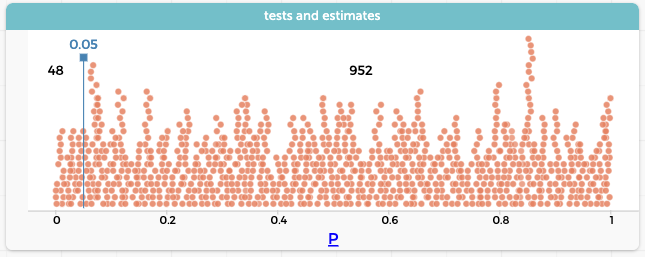
It’s flat! And of course in this graph we can see that we got 48 type I errors, which is pretty darned close to the expected value.
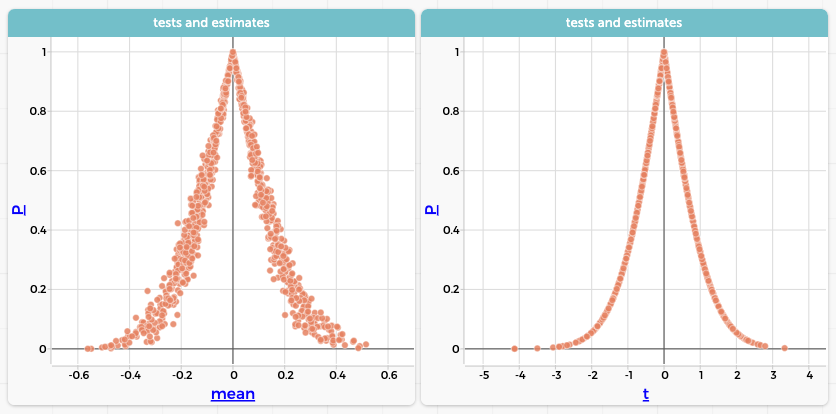
Or how about this: below you can see two graphs. On the left, the P-value as a function of the sample means. On the right, the P-value as a function of $t$. Explain the similarities and differences between these graphs.…
Isn’t that great? Once you have any information in a table—in this case, results from multiple tests—you can explore it by making graphs or using any of CODAP’s built-in tools. Using the testimate plugin to emit data from statistical tests essentially lets us make datasets about … datasets! And that lets us examine more deeply how we do our data analysis.
I can practically guarantee that, whatever level of stats experience you have, if you explore tests and estimates with testimate — and invent one of these investigations—you will see something illuminating.