Julia LaCava was a summer intern at the Concord Consortium. A junior at Ithaca College, she majors in communications.
Earth’s surface is dynamic and changing all the time. Volcanic eruptions and earthquakes alter the landscape, sometimes in very dramatic and sudden ways. On a much longer time scale, the movement of Earth’s plates can change the shape of oceans or the locations of continents.
Students often don’t think of Earth’s surface as changing, yet the evidence for its movement is well documented. In order to think like scientists, students need access to tools that can help them look at scientific data. Such earthquake data is easy for students to track and observe using the Seismic Explorer created by the Concord Consortium’s Geological Models for Explorations of Dynamic Earth (GEODE) project.
The Seismic Explorer is a data visualization tool, allowing students to observe up-to-date seismic events, data about current plate motion from the United States Geological Survey (USGS), and historical data about volcanic eruptions from the Smithsonian Institution Global Volcanism Program.
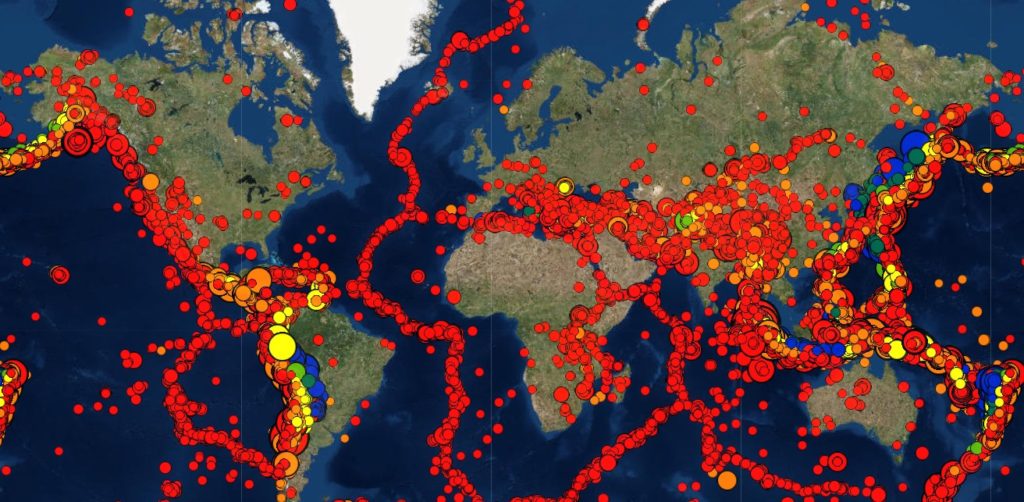
The Seismic Explorer is an intuitive visualization. Users can toggle between the data they want to see, watching events occur through time, pausing and rewinding, if necessary. Seismic activity is represented by different color and size circles, representing earthquake depth and magnitude, respectively. Volcanic eruptions are represented by small triangles.
Users can easily explore the distribution of these phenomena around the Earth’s surface. They can also create cross-sections, helping them identify patterns found at different types of plate boundaries. The pattern of earthquakes as seen along the convergent boundary in Figure 1 helps students understand how geoscientists are able to describe where plate boundaries are located. Students are encouraged to compare the depths of earthquakes along different boundaries.
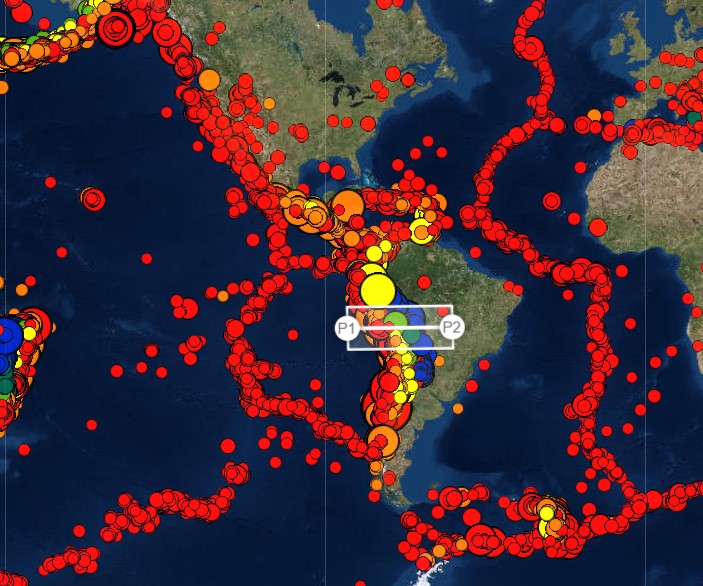
Figure 1. Earthquakes occur in linear patterns and define where plate boundaries are found. The color of the circles represents depth and the size of the circles represents the magnitude of each earthquake. Students can draw a cross section anywhere in the map to observe patterns of earthquakes below the surface.
In Figure 2, students can see how earthquakes might define plates as one moves underneath the other. Can you imagine what pattern they might see at divergent boundaries?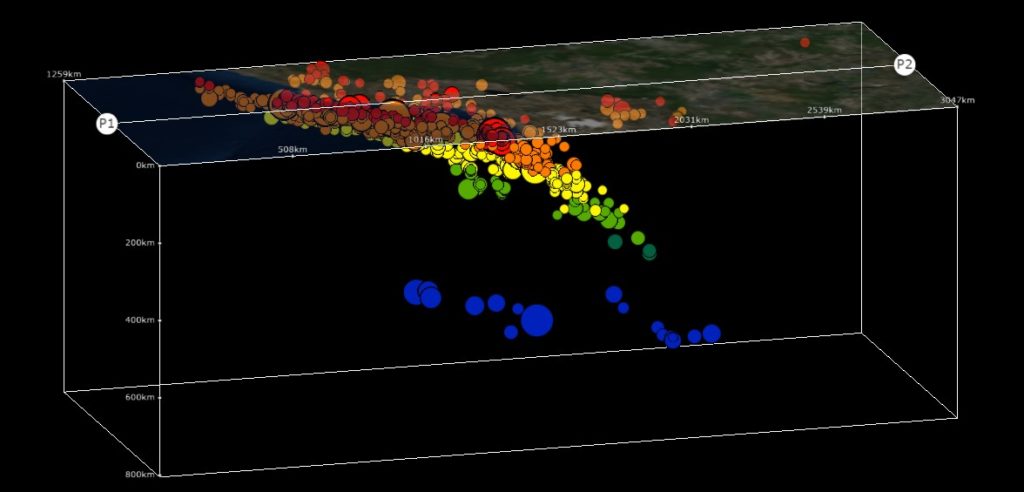
Figure 2. The 3D cross-section makes it easier for students to see patterns in earthquake locations. Here, a subduction plate is revealed.
Students can also easily observe the distribution of volcanic activity and how it is not randomly distributed. Through simple controls, students consider how the correlations of earthquakes and volcanoes are related to plate boundaries and plate interactions.
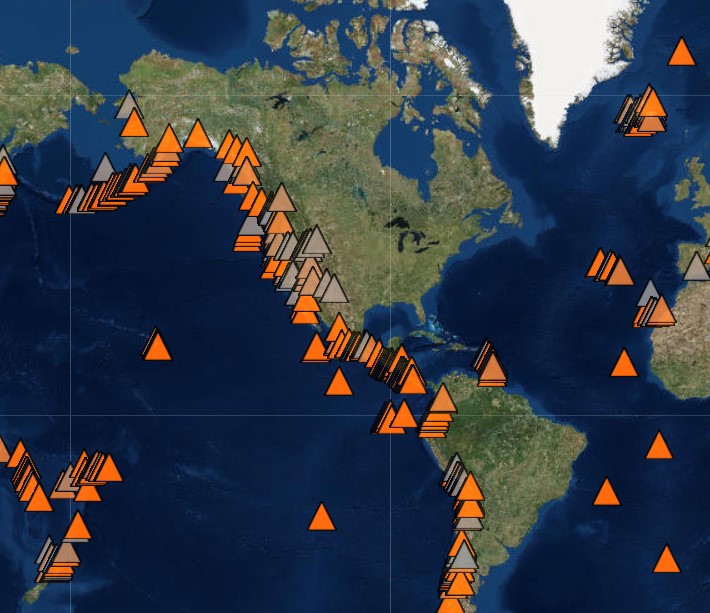
Figure 3. Seismic Explorer also shows the location of active and inactive volcanoes.
Understanding and visualizing plate boundaries and their movement can be observed directly with Seismic Explorer. By selecting “plate boundaries” and “plate movement” in the Data Type Menu, a student can view the size of plates and their direction and rates of movement.
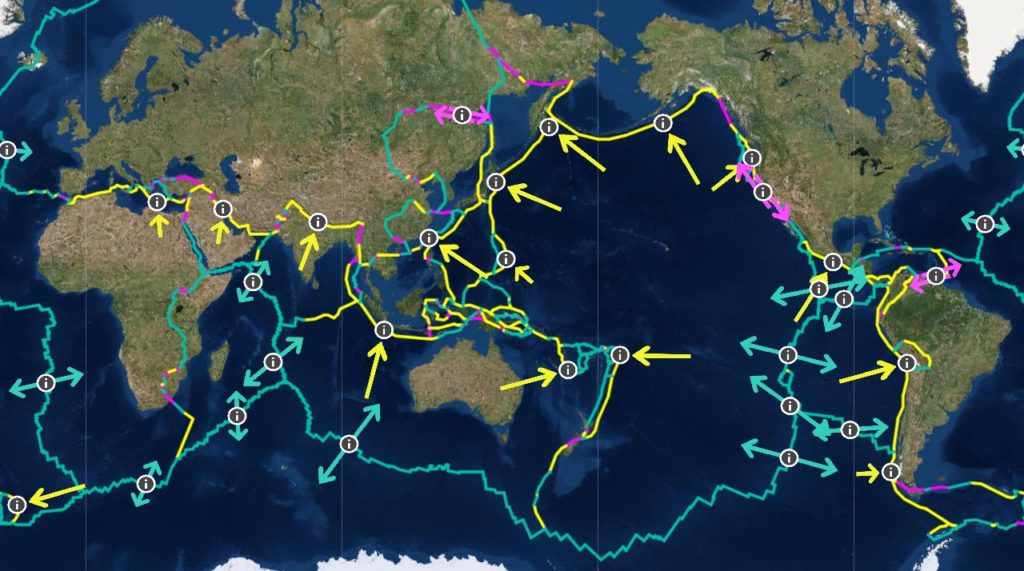
Figure 4. Plate boundaries can be displayed. The vectors show the direction and magnitude of plate motion.
Seismic Explorer can be used as a stand-alone tool, and is also embedded in a scaffolded online GEODE Plate Tectonics module “What will Earth look like in 500 million years?” It’s perfect for teaching your students about seismic and volcanic activity.