We typically think of stories as a narrative composed of text or perhaps text and images. But in the Data Age (i.e., right now), we hope to expand that definition to include data. The goal of the National Science Foundation-funded Writing Data Stories project is to help middle school students tell stories about patterns they discover in data and how data help them make decisions in their own lives. The project is a collaboration among Michelle Wilkerson and Kris Gutierrez at the University of California Berkeley, Hollylynne Lee at North Carolina State University, Tim Erickson at Eeps Media, and the Concord Consortium.
Tim and I are developing a CODAP plugin called Story Builder for students to create their data stories. A normal CODAP document allows you to transform data, add or change data visualizations, and include pictures. Great stuff, but not exactly a story. What’s missing is the path that led to the resulting data visualizations. Some users have gotten around this by taking screenshots of graphs and pasting them into slides. Unfortunately, those data then become static.
We want students to be able to illustrate their stories and not lose the ability to interact with the data. That’s where the Story Builder plugin comes in. Below you can see the beginning of one of my favorite data stories from the Ocean Tracks project with four “moments.” Each of the numbered moments in Story Builder stores the state of CODAP (including data visualizations, plus images, text boxes, etc.) when that moment was saved.
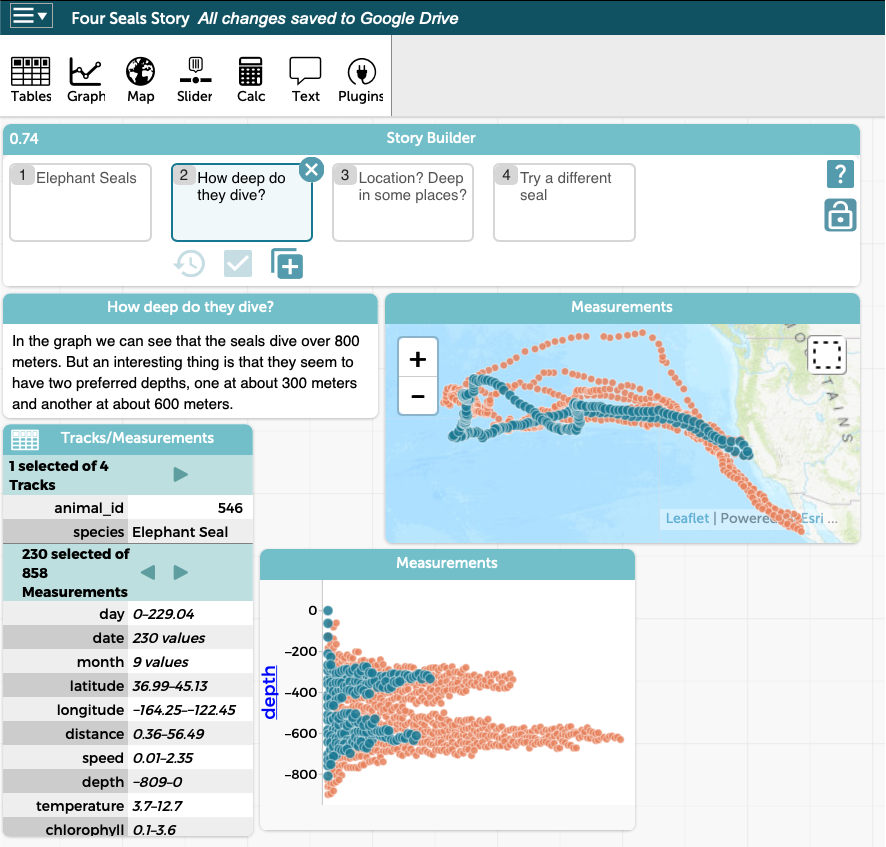
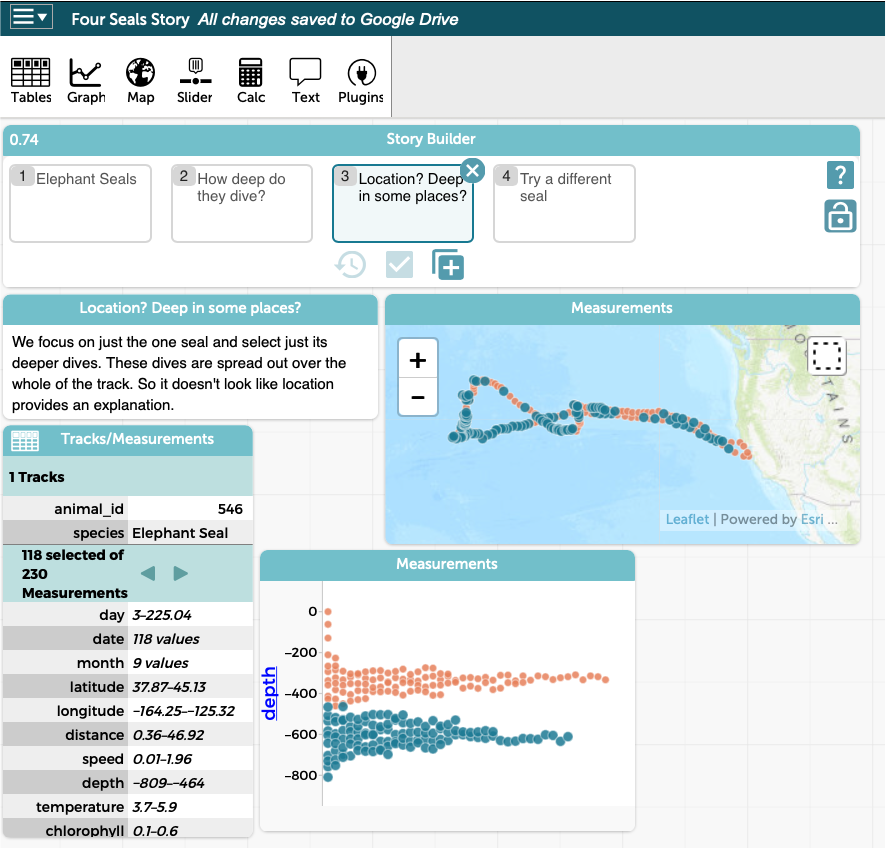
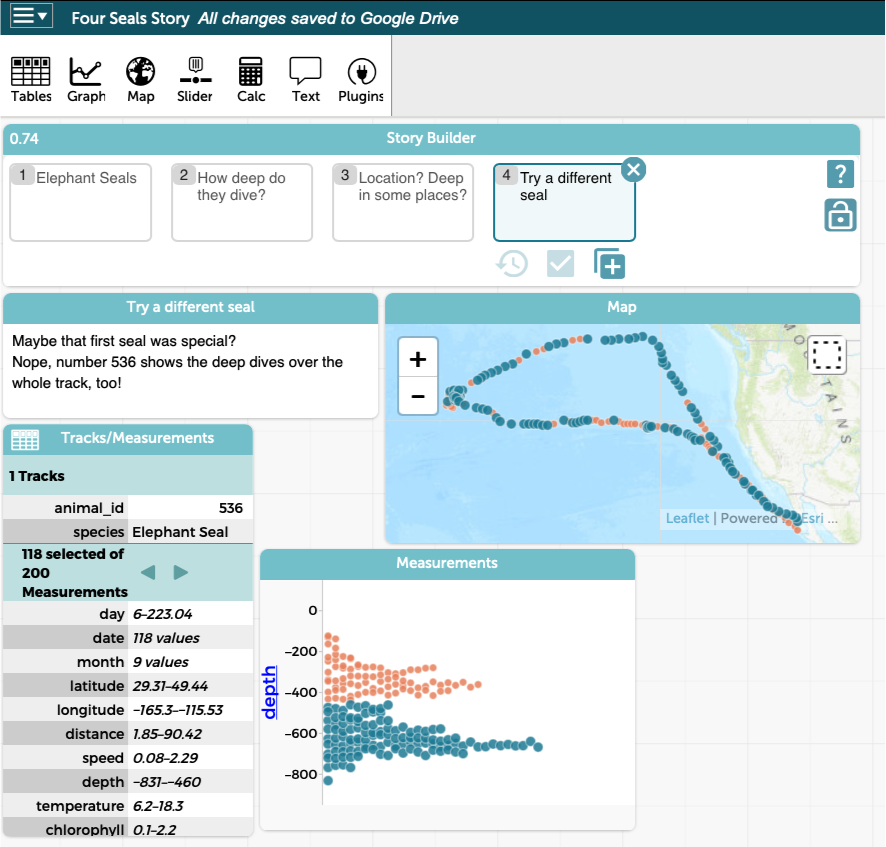
Do elephant seals have two preferred depths of diving? What does the data say? What does the story tell us?
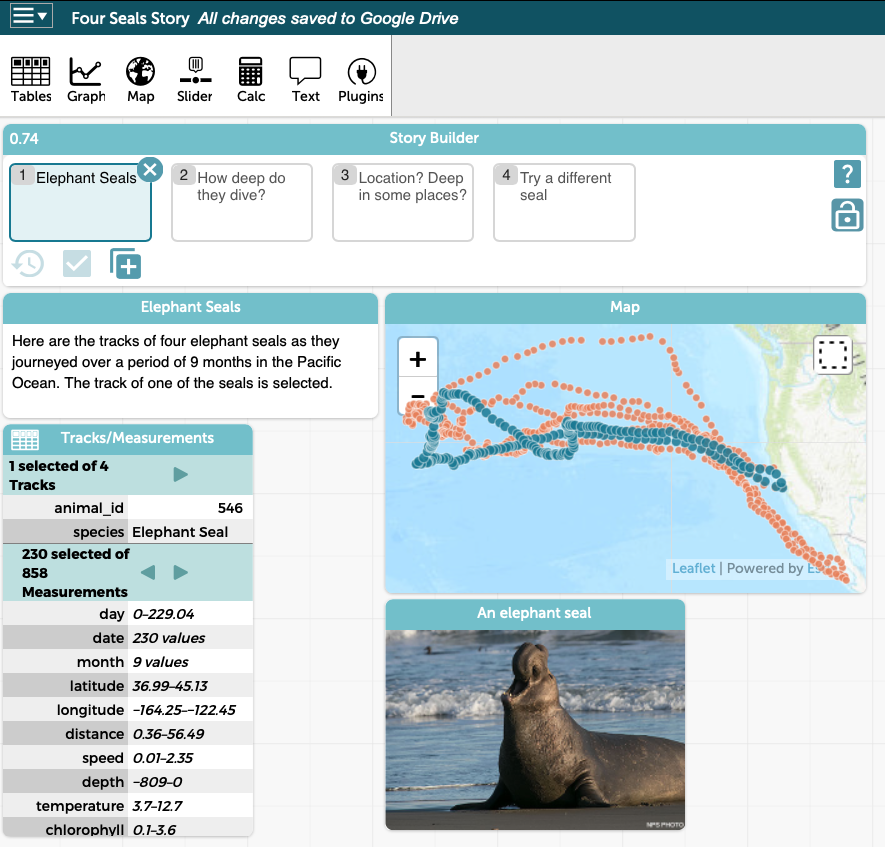
(Open the Four Seals Story CODAP document to explore the data. Click on a different moment and you get a different state.)
In addition to graphs and maps, you can include pictures, web pages, and movies in a Story Builder moment. You can go back and edit the moments and change their order. When you think you’re finished, you can “lock” the story so that you don’t need to worry about you or anyone else making additional edits. When you go to a moment you can still interact with the data, selecting different cases, changing what’s plotted on graphs, and making new graphs. And if you’re presenting your story to your colleagues or classmates, you can answer questions by actually trying things out!
Middle school students are beginning to try Story Builder in pilot classes. We look forward to seeing their original data stories and to learning how they use the Story Builder plugin in unexpected ways, too.