 |
| Fig. 1: Winter in Boston |
One of the strengths of our Energy3D CAD software is its 3D visualizations of energy transfer. These visualizations not only allow students to see science concepts in action in engineering design, but also provide informative feedback for students to make their design choices based on scientific analyses of their design artifacts.
 |
| Fig. 2: Summer in Boston |
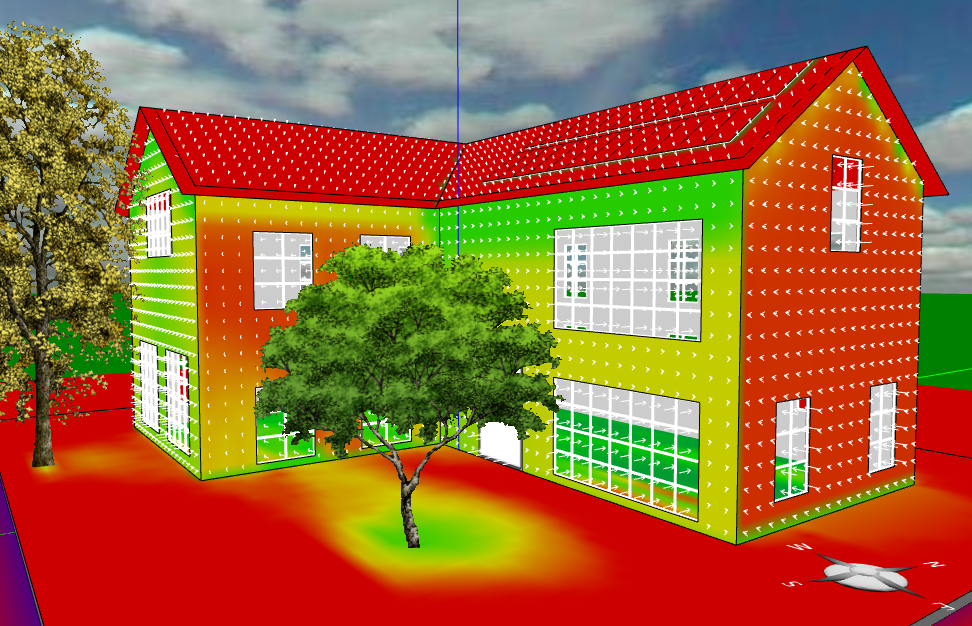
A new feature has been added to Energy3D to visualize heat transfer across the building envelope using arrays of arrows. Each arrow represents the heat flux at a point on the surface of the building envelope. Its direction represents the direction of the heat flux and its length represents the magnitude of the heat flux, calculated by using Fourier’s Law of Heat Conduction. Quantitatively, the length is proportional to the difference between the temperatures inside and outside the building, as well as the U-value of the material.
 |
| Fig. 3: Winter in Miami |
The figures in this post show the heat flux visualizations of the same house in the winter and summer in Boston and Miami, respectively. Like the solar radiation heat map shown in the figures, the heat flux is the daily average. The U-value of the windows is greater than those of the walls and roof. Hence, you can see that the heat flux vectors in the winter sticking out of the windows are much longer than those sticking out of the walls or roof. In the summer, the heat flux vectors point into the house but they are much shorter, agreeing with the fact that Boston’s summer is not very hot.
 |
| Fig. 4: Summer in Miami |
Now move the same house to Miami. You can see that even in the winter, the daily average heat flux points inside the house, agreeing with the fact that Miami doesn’t really have a winter. In the summer, however, the heat flux into the house becomes significantly large.
These visualizations give students clear ideas about where a house loses or gains energy the most. They can then adjust the insulation values of those weak points and run simulations to check if they have been fixed or not. Compared with just giving students some formulas or numbers to figure out what they actually mean to science and engineering practices, experiential learning like this should help students develop a true understanding of thermal conduction and insulation in the context of building science and technology.
Here is a YouTube video of the heat flux view.