
Capturing Moths and Studying Data Science
The National Science Foundation-funded MothEd project is co-designing an exciting field science curriculum with a team of three middle school and two elementary school teachers, entomologists from Michigan State University led by Peter White, researchers led by David Stroupe at the University of Utah, and software developers at the Concord Consortium under the direction of Frieda Reichsman.
The goal of the curriculum is to foster students’ ability to develop and investigate their own research questions and their own systems for organizing and making sense of data they collect about moths in their local environment. MothEd uses our Collaborative Learning User Environment (CLUE) platform to frame and support students’ research activities. CLUE includes a variety of features to help young scientists document their moth data, share their data and ideas, and engage with simple yet multi-featured tools for gathering and analyzing data to figure out what stories their moth data are telling them.
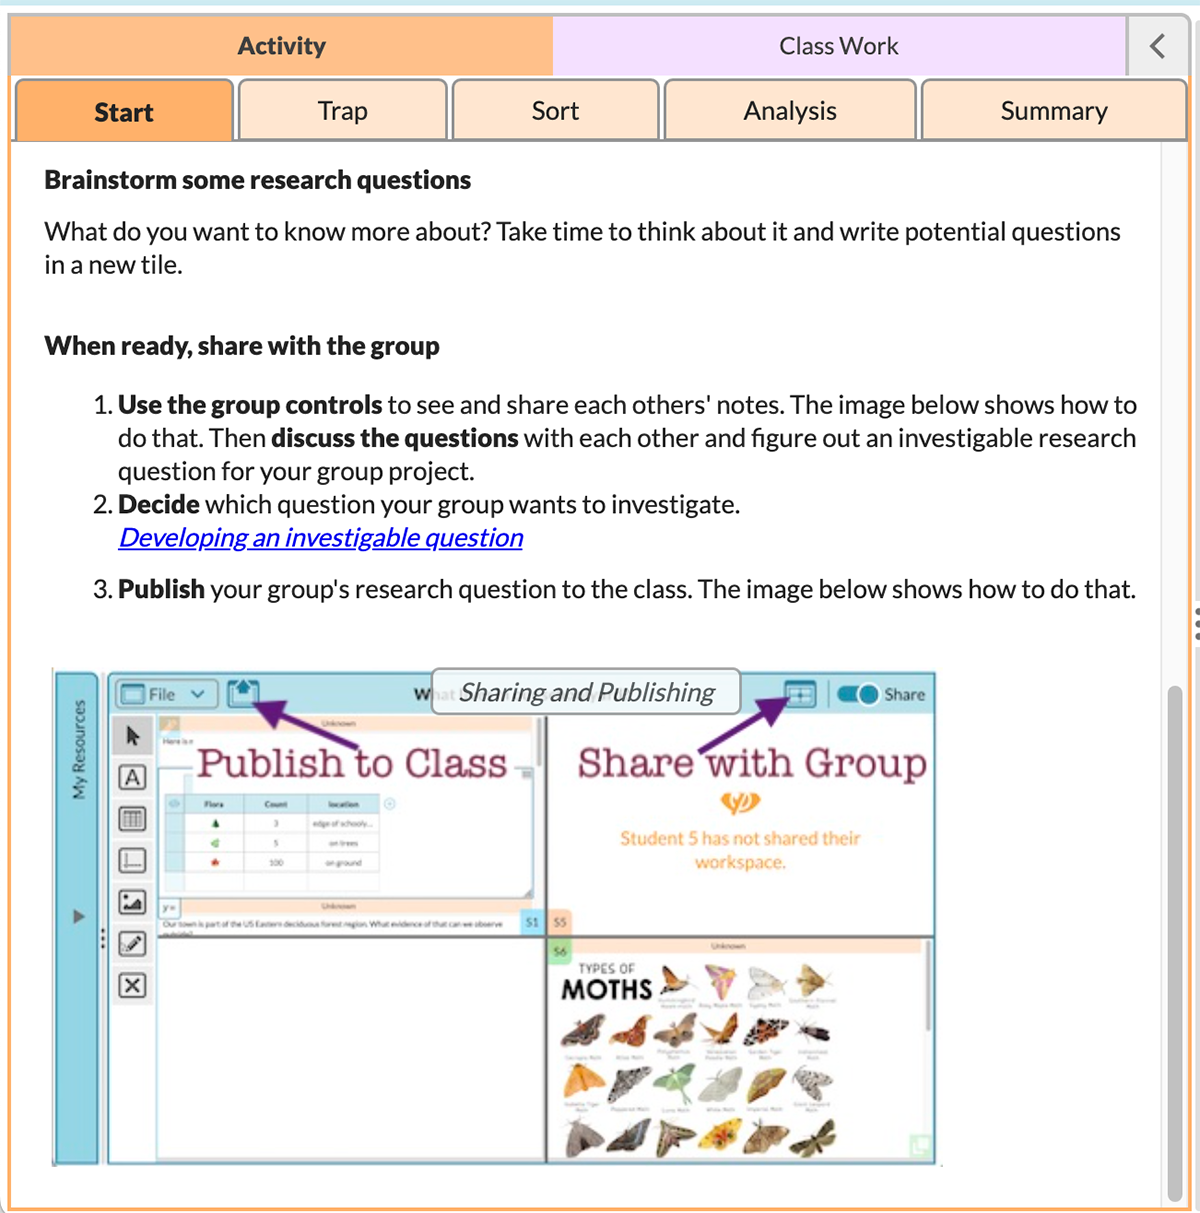
After learning about moths in the “Start” tab of the online moth unit (Figure 1), small groups of students brainstorm investigable questions. Using CLUE, they document their questions and share them with their group mates or publish to the class for a full discussion of potential questions for field research.
Gathering data
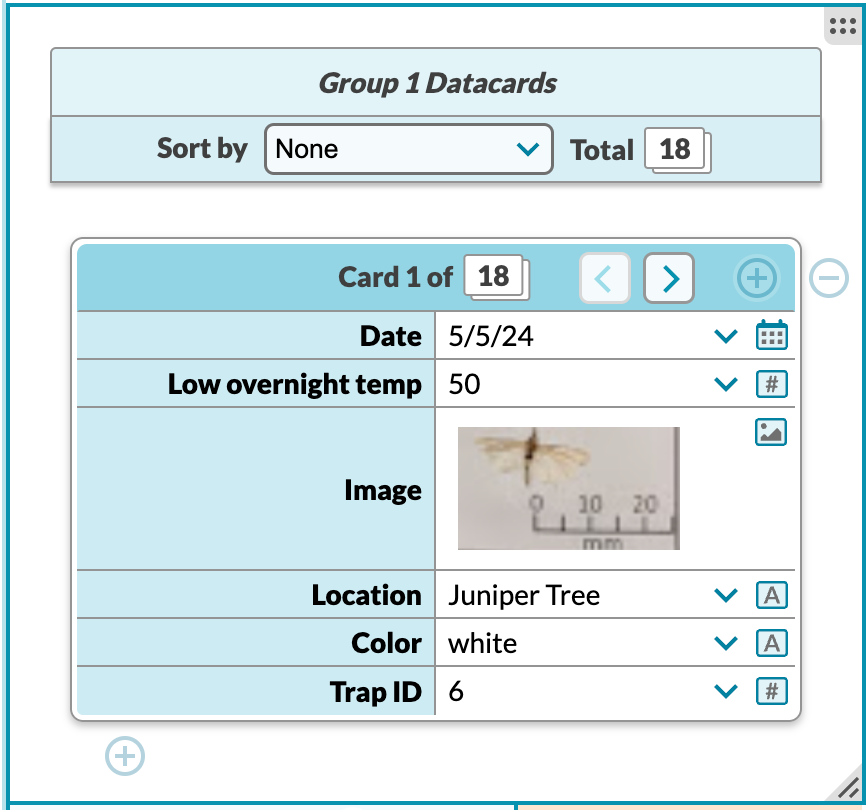
Students build and set simple traps, guided by images and videos in the “Trap” tab. They bring what they capture into class to sort, pin, and photograph. (An upcoming article in Science Scope* details the hands-on aspects of the curriculum unit in more detail.) Students record information about their captured moths using CLUE’s data cards. Each card becomes a list where students enter relevant information about a specific moth they have caught, for example, the trap location under a tree, near flowers, or on a porch.The categories are chosen by the students, depending on what they are investigating. In addition, students are encouraged to describe several attributes that moth scientists also record, including the date of capture, image, and trap ID. Students can explore their data in various ways by grouping the cards into categories and transforming the data on the cards into graphs and tables. (For more information on data cards, see “Under the Hood: Data Card Deck” in the fall 2023 @Concord.)
Analyzing data
Imagine a group of students trying to figure out whether moths prefer visiting juniper trees, sagebrush, or rabbitbrush, all naturally occurring flora in their local high desert region. The students must first craft a research question together: What types of native plants and trees do moths prefer? The group’s thinking is that if they know more about moth preferences, they may be able to take better care of the plants around them that benefit these native pollinators. Students set traps in three different areas, all at the same height and all on the same overnights, with the same forecast: little wind and no rain. They then document the moths from their trap on data cards in CLUE, and combine them into a larger stack of cards for the group (Figure 2).
As students review their data cards, they might notice additional variables they want to track, such as different wingspans. The additional data can be added to each data card later. When it comes time to sort the moth data into groups, by date, location, or color, etc., they may find that their data need to be “cleaned” to be more useful. For instance, different students might use different date formats or spell words differently, resulting in sorting the same data into separate groups. Once group mates combine their data cards by sharing their work with one another on the CLUE platform, sorting the cards into categories makes this cleaning easy. To unify the entries in a category, students simply drag cards from one category stack over to the stack that has the correct format or spelling, and the entry is automatically updated.
Sorting data cards so they are grouped into categories is a way of making data “hierarchical,” similar to what data scientists do when exploring relationships among variables. Going from a single stack of cards to stacks that are sorted by moth color, for example, is a hierarchy by color. In the same way, a completely different hierarchy of cards would be made if moths were instead sorted by antenna type or body length. Younger students can be introduced to datasets with multiple variables using physical data cards, which can be sorted by hand into categories as students think about their data. This activity leads to the creation and sorting of virtual cards, thus scaffolding understanding of hierarchical data.
Interpreting data and revealing stories
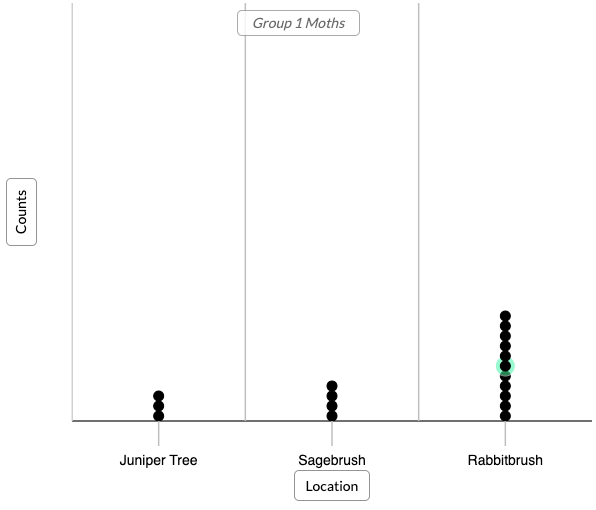
With a single click in CLUE, students can create a graph from their data cards. Then they can easily change the graph axes to explore different questions they may have about how different variables relate to one another. At times, students expect certain patterns to emerge in their data. When alternative patterns emerge instead, students can easily explore them using data cards and graphs, forming new understandings of the world around them. The data representations are linked so that, for example, selecting and highlighting a value on a card highlights the corresponding point on a graph (Figure 3). Students can readily create multiple visualizations of their data, position them on the CLUE workspace, and take notes about their observations.
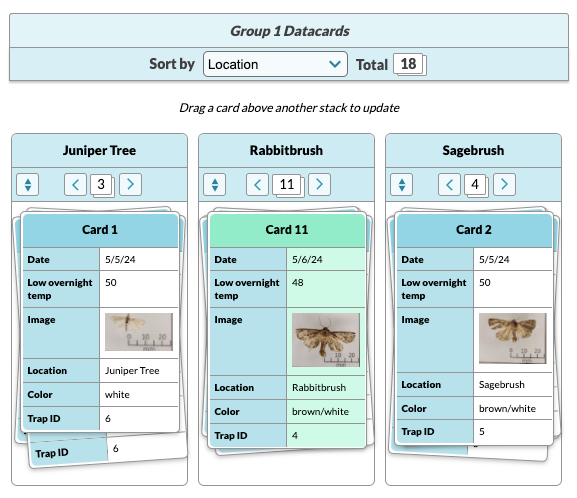
In the above scenario exploring moth preferences for different flora, sorting cards by location reveals that rabbitbrush is the clear winner (Figure 3a). Transforming the data into graph form allows quick, clear communication of this finding (Figure 3b). If other groups in the class also placed traps near juniper trees, sagebrush, or rabbitbrush for their investigations, their data cards could be added to these initial findings. Additionally, sorting data cards representing each moth into groups based on their categories eases the transition to graphing as students are more likely to realize that each point on the graph represents a single moth that they caught.
Understanding that moths may prefer rabbitbrush, students might then think about how they can preserve the flowering shrub that is often cleared from construction sites or consider planting it in their neighborhood or school grounds as a way to attract more pollinators. Working with local, meaningful data is a critical skill that can lead students to informed community service—and to finding interesting new facts about the world that is flying by.
*Keas, B., White, P. T. J., Brown, C. B., Stroupe, D., Best, S. G., & LeTarte, M. (in press). Conducting authentic moth research with students to encourage scientific inquiry. Science Scope.
Sarah Haavind (shaavind@concord.org) is a senior research project manager.
Frieda Reichsman (freichsman@concord.org) is a senior research scientist.
This material is based upon work supported by the National Science Foundation under Grant No. DRL-2100990. Any opinions, findings, and conclusions or recommendations expressed in this material are those of the author(s) and do not necessarily reflect the views of the National Science Foundation.