
Under the Hood: DataCard Deck
The MothEd project aims to foster students’ ability to develop their own systems for organizing and making sense of the data they collect about moths in their local area. We developed a new online tool for our Collaborative Learning User Environment (CLUE) called the DataCard Deck to give students a just-structured-enough platform for collecting and sorting their moth data, discovering relevant attributes, and refining their data structure on the fly.
In the physical world, a box of index cards is a useful data collection and organization tool. For example, imagine that you have collected a number of moth specimens in the field and have created a card for each. You might label each card with the date, the moth’s length, color, and other attributes. Later, as you collect more cards, you might try to make sense of your data by sorting and resorting by various attributes. However, with enough cards, repeated sorting and editing can become tedious.
We designed the DataCard Deck to replicate this functionality and add some computer-powered conveniences: students need to be able to quickly and automatically sort by any attribute, readily add attributes, and have the ability to change values by dragging a card from one group to another. For example, if a student enters the values “small” and “large” for the size attribute, but mistypes some as “smll” or “Small,” the DataCard Deck will sort these different values into separate piles. The student should be able to simply drag the mistyped cards to the correct “small” group and not have to retype “small” in the “size” field.
Our first development goal was to create a card-like experience, where students can create cards, and at any time add a new characteristic or attribute to a card, change its value and name, and have that reflected in every card in the deck. Given this flexibility, we also wanted to help students maintain the integrity of their data by reminding them not to create duplicate attributes.
By using our existing dataset API, we are able to check that the underlying dataset does not already have an attribute with the same name before allowing a student to save it.
const handleCompleteName = () => {
    if (labelCandidate !== getLabel()) {
        const names = content.existingAttributesWithNames().map(a => a.attrName);
        if (!names.includes(labelCandidate)){
            caseId && content.setAttName(attrKey, labelCandidate);
        }else{
            showRequireUniqueAlert(); }
        }
    }
};
Our second goal was to allow students to quickly sort and resort their cards by any attribute, allowing them to find patterns in their data.

<div className="sort-area-grid">
    {uniqueOrderedValues.length > 0 && sortById &&
        uniqueOrderedValues.map((value, i) => {
            return (
                <SortStack
                    key={`${sortById}-${value}`}
                    id={`${sortById}-${value}`}
                    model={model}
                    stackValue={value}
                    inAttributeId={sortById}
                    draggingActive={sortDragActive}
                />
            );
        })
    }
    {renderPlaceholderCells()}
</div>
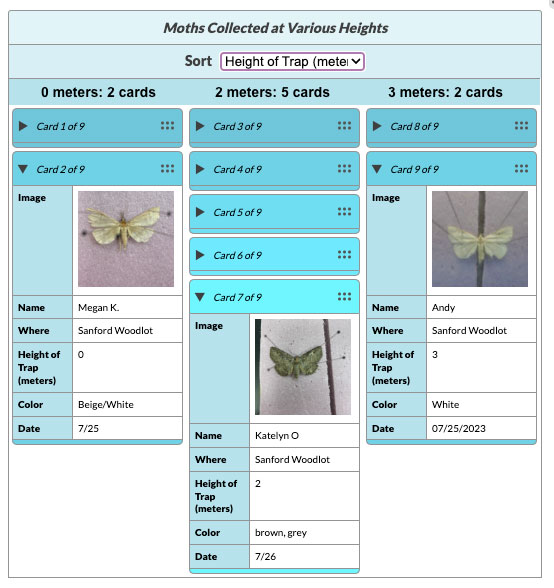
To accomplish this, we again leveraged the dataset API and added a basic sort state view. We call on one of our React components to display a stack of cards with a title that shows what attribute and value the cards have in common (Figure 1).
Finally, we needed to be able to allow students to not only see their sort groups but to move cards between them, rewriting the relevant data on the cards when they change groups. We leveraged the DnDKit library and again called on our dataset API to do the heavy lifting and change the underlying data.
onDragEnd: (e) =>; {

    if (e.active.data.current?.sortDrag) {
        const draggingId = e.active?.data?.current?.caseId;
        const attrId = e.active?.data?.current?.sortedByAttrId;
        const draggedToValue = e.over?.data?.current?.stackValue;
        draggedToValue && content.setAttValue(draggingId, attrId, draggedToValue);
        setSortDragActive(false);
    }
}
Structuring, analyzing, and interpreting data are key scientific practices. With DataCard Decks, elementary and middle school students can collaboratively and iteratively organize the data they collect in ways that make sense to them as they develop and refine their investigations.We’re currently studying how students use these data cards so we can add new features to make their investigations even more productive and exciting.
Get the DataCard Decks code on GitHub.
Joe Bacal (jbacal@concord.org) is a software engineer.
This material is based upon work supported by the National Science Foundation under Grant No. DRL-2100990. Any opinions, findings, and conclusions or recommendations expressed in this material are those of the author(s) and do not necessarily reflect the views of the National Science Foundation.