
Stephanie Harmon is a Science Consultant with the Partnership Institute for Math and Science Education Reform (PIMSER) in Kentucky. Previously, she taught Earth science and physics at Rockcastle County High School in Mount Vernon, Kentucky, and has consulted on several Concord Consortium projects.
For my students in rural Kentucky, floods are personal.
In July 2022, heavy rainfall resulted in localized flooding of the Dix River in central Kentucky, home to many of my students. When waters receded less than 24 hours later, they left behind damp basements and muddy lawns for some of my students’ families.
At the same time, severe flooding along the Kentucky, Red, and Licking Rivers in Eastern Kentucky was more devastating. Lives were lost, businesses destroyed, and schools washed away by the force of the high waters.
When my students and I began the school year that fall, these nearby counties were determining how to best serve their students’ families and considering where they could safely meet for school. My students came into class with many questions:
- Why did those rivers flood more than the Dix River?
- How much more rain did Eastern Kentucky receive compared to us?
- Are there differences in the land that make some areas more prone to flooding?
- Can this happen again soon?
- Is this an example of a “100-year flood”?
We continue to return to these questions even now. Some have been answered by examining data from the National Weather Service and NOAA (National Oceanic and Atmospheric Administration). We are exploring others by using the Concord Consortium’s Flood Risks & Impacts module.
Flood risks and impacts
The Flood Risks & Impacts module is anchored around the question, “How will flood risks and impacts change over the next 100 years?” As students work through the module’s five activities, they examine four factors that impact flooding through use of the interactive Flood Explorer. The simulation allows students to explore a fictionalized inland river that flows past both rural and urban areas.
Early in the module students are introduced to the Flood Diamond (Figure 1). This graphic highlights four factors that influence the extent of flooding: precipitation, topography, permeability, and the water table. Students then use the Flood Explorer to examine the relationship between each factor and flooding events. The Flood Explorer allows students to investigate inland river flooding by having them change input parameters such as rain amount, storm duration, and starting (ground) water level. Students can observe flood areas on a map and examine cross-sections along the river at stream gauges to see the extent of flooding and water inundation.
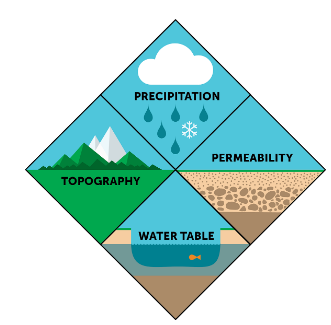
Figure 1. The Flood Diamond, illustrating the four factors of flooding: precipitation, topography, permeability, and water table.
As students explore how the topography of the fictional town of Silverton affects flooding and see various images of river floods, it is interesting to listen to their conversations. Their discussions reveal how they are beginning to make sense of the phenomena and make connections between what they observe in the simulation and our community and state.
The module slowly introduces each factor that affects flooding through the addition of new features in the Flood Explorer. Students were able to connect data that revealed the increase in historical levels of flooding to the flooding in Eastern Kentucky. They asked powerful questions such as: Does that flood qualify as a 100-year flood or possibly a 500-year flood? If these types of floods are increasing, what does it mean to those communities? Our community? Does it mean the local seasonal floods will become more severe?
Making connections while using the Flood Explorer
The Flood Explorer allows students to investigate their questions. In Activity 3, for example, students compare flooding in a rural area and flooding in the same area after it has become urbanized (Figure 2). This resonated with my students because we have experienced a shift in local land use in recent years. The simulation allowed my students to investigate permeability and how land use affects flooding. Graphs of flooded area versus time, along with qualitative observations of the map, enabled my students to analyze the impact of land development. At the end of the activity students considered what they learned from using the simulation when thinking about what it might mean to add green space into the city as a potential mitigation technique.
Below are the permeability maps for the two.
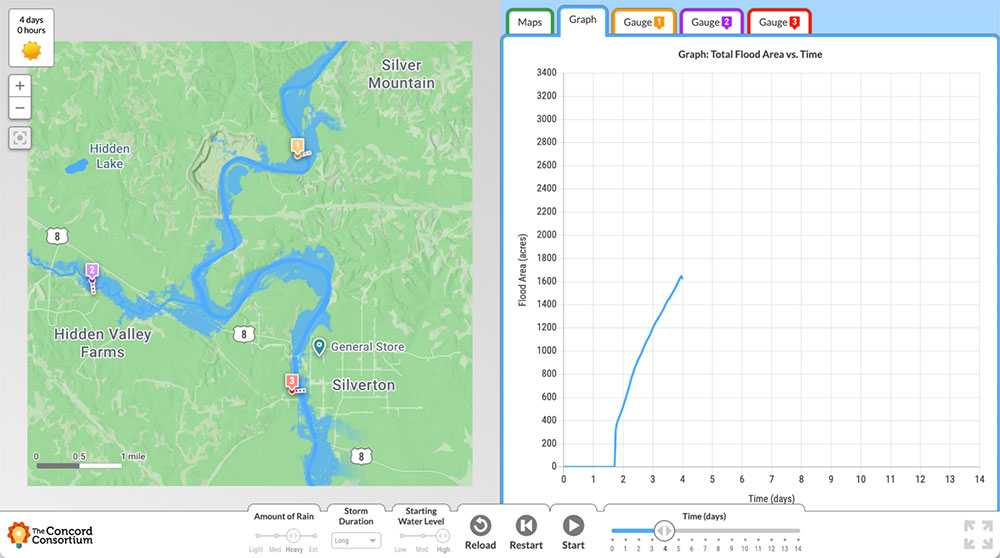
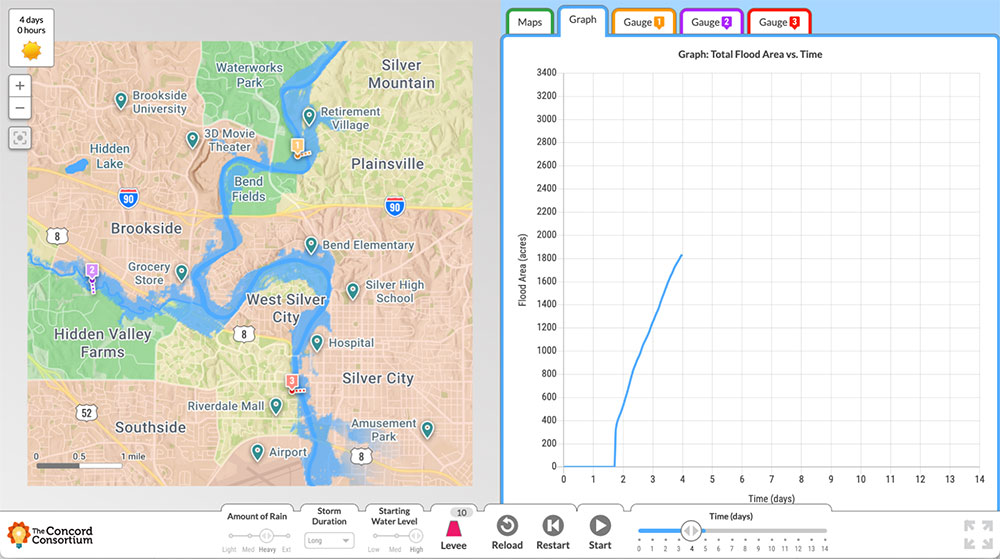
Figure 2. Students run the Flood Explorer to compare the flooding in a rural area (top) to the flooding in the same area after it is urbanized (bottom). Bright green is the most permeable (rural area) and red is least permeable (urban area).
After this activity, we had a class discussion and the conversation turned to a small local park along the edge of the Dix River. Students wondered if the park had been built to mitigate flooding in the community. They discussed the permeability of the park, surrounding streets, and a nearby subdivision. They also wondered about the use of green spaces around areas that had been impacted by the recent Eastern Kentucky floods. They used evidence from the simulation to support their claims and make connections between it and our community.
As students continued working through the module, they used the Flood Explorer to examine flood hazards, particularly inundation and strong currents. Students compared images of flood damages with others of the recent local flood impacts. This conversation was so rich because students were able to make connections between the module and their personal lives.
When the Flood Explorer added a feature that allowed students to place levees along the river, their conversations become even more sophisticated. We discussed whether levees at various points along the Kentucky, Red, and Licking Rivers could prevent future flooding. I witnessed them using evidence from the simulation to support their claims and challenging each other’s ideas.
Finally, in Activity 5, students explored the future of flooding and how climate change correlates to projected changes in flood frequency, intensity, risk and impact. In this activity, the “Extreme Rain” option was added as a parameter in the Flood Explorer. This enabled students to explore the role extreme rainfall events and urbanization have on flooding. Examining the cross-sections of the flood areas was particularly salient and helped students make comparisons about flood impacts on humans in urban and rural areas (Figure 3). At the end of the module we discussed how urbanization increased flooding potential and how this influenced flooding in Eastern Kentucky.
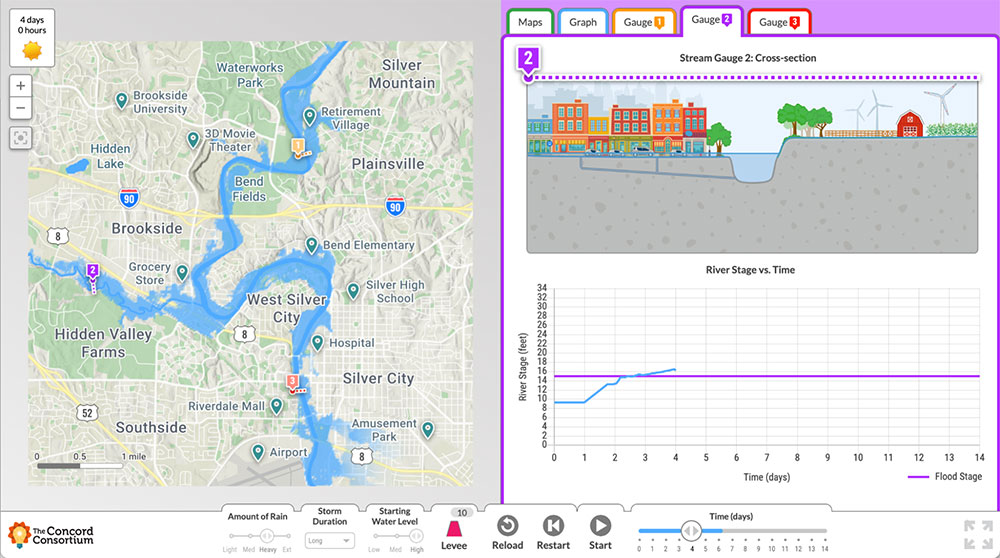
Figure 3. Students compare the differences in flooding between rural and urban areas by investigating flooding at three stream gauges.
Students use their findings from their experiences throughout the module to answer the question, “How will flood risks and impacts change over the next 100 years?”
Making student thinking visible
While students engaged with the module, they recorded their ideas on individual summary tables. Since everyone crafted their own, it also gave each student an entry point into the partner and whole class discussions. The summary table is a living document where students’ ideas change and grow. Part of the debriefing discussions we had at the end of each activity included an opportunity for students to examine what had already been shared and to make edits to their own summary table based on new thoughts about what they learned.
The summary table is scaffolded to hold information as the student works. Each module activity has a row on the table. The columns help students develop their explanation of the phenomena. In the first column students record their observations about what they see happening as they run the simulation. In the second column students write about what they think might be the possible causes of the observations or patterns. The third column has students think about how their observations help them answer the module’s driving question, “How will flood risks and impacts change over the next 100 years?” (Figure 4).
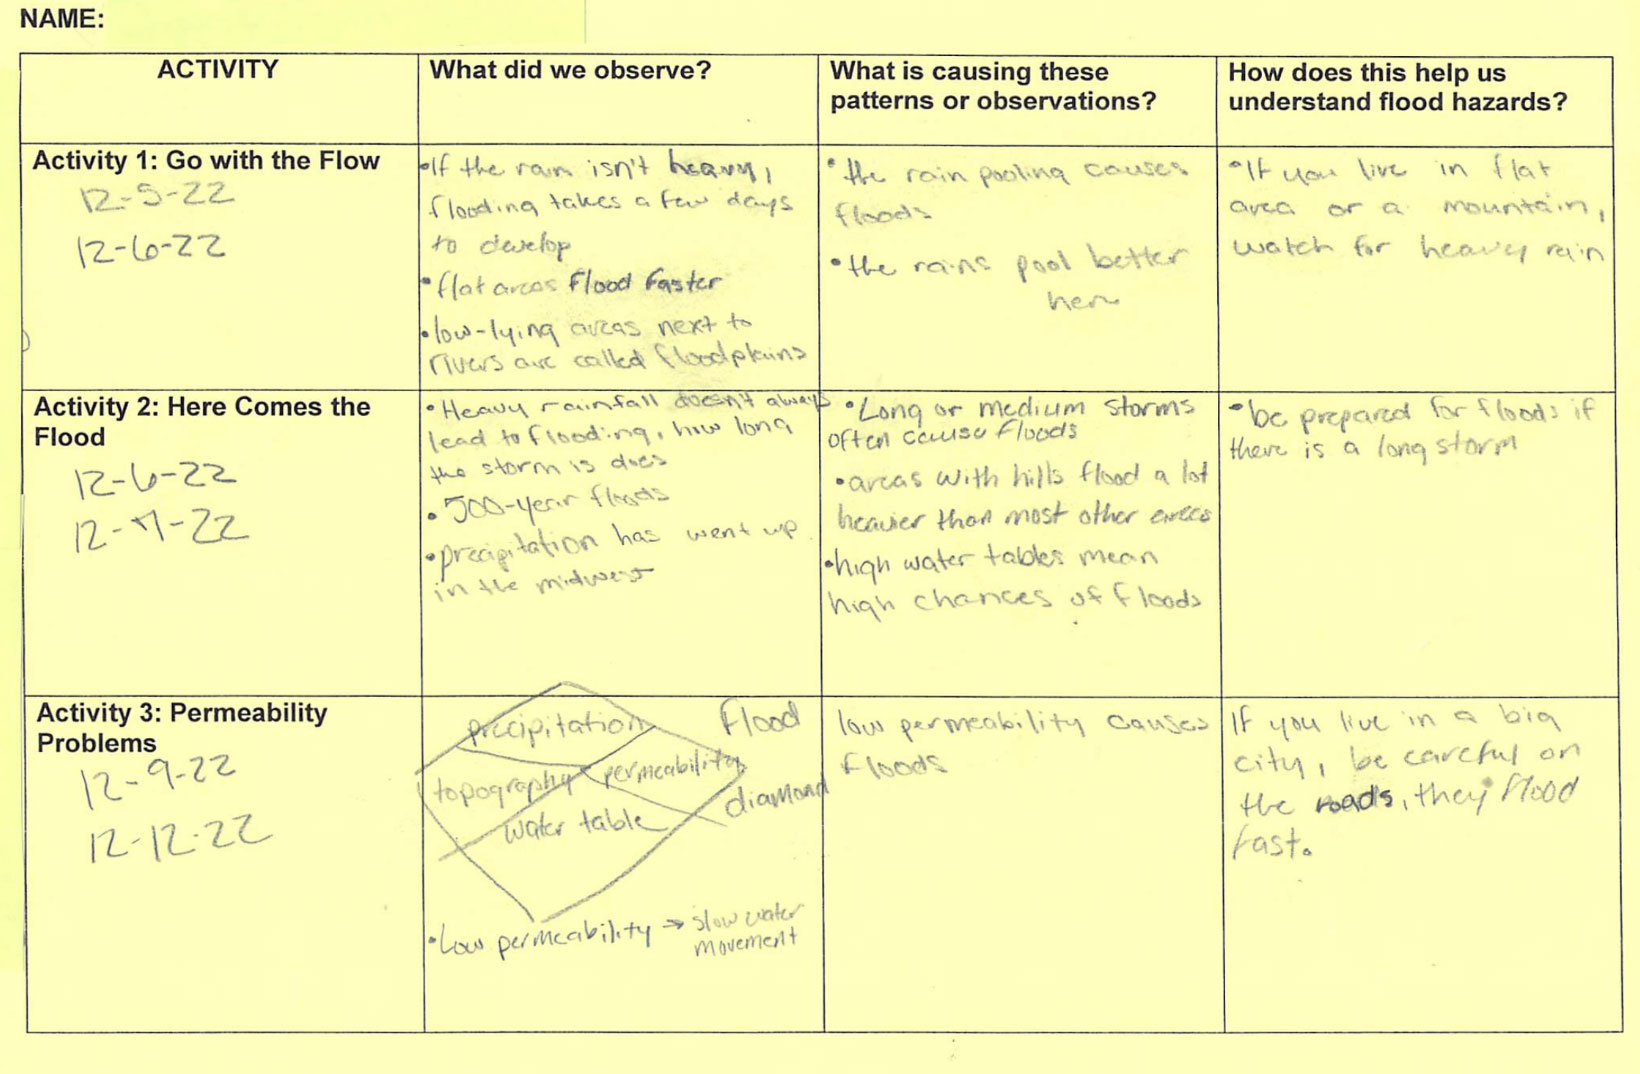
Figure 4. An example of one student’s summary table.
Students also contribute to a whole class summary table (Figure 5). An example of this can be seen when we had a whole class discussion, following Activity 4. Here students realized why the placement of levees is important and explained how decreasing the flood risk in one area can potentially increase the flood risk in another area.
| Whole Class Summary Table | What did we observe? | What is causing these patterns or observations? | How does this help us understand flood hazards? |
|---|---|---|---|
| Activity 4: Flood Hazards |
|
|
|
Figure 5. Students contribute their ideas to the whole class summary table.
Student takeaways
The Flood Risks & Impacts module gave my students an opportunity to examine a variety of scenarios—some similar to their own experiences, others that are quite different. Using the Flood Explorer enabled them to investigate many different circumstances and apply their findings to floods in our area. It was interesting to witness how students’ ideas changed as they worked through the module. They started with a series of questions, found answers to many of them, and walked away with new questions to consider. It was remarkable to see students make connections between their investigations with the simulation, our community, and the Eastern Kentucky floods.
My students developed a deeper understanding of the seasonal flooding we sometimes experience and the more recent extreme flooding in Eastern Kentucky. The ability to visualize different flood scenarios while using the Flood Explorer without real-life risk enabled students to consider real flood impacts. They discussed ideas for mitigation methods and how to educate others about flood prevention. They communicated and interacted with each other in the same way that real scientists do. They also gained a deeper understanding of the natural world and how to interact with it. Most importantly, my students were able to make connections between the factors that influence flooding and the real-life and very personal considerations they or someone they know have to think about.
One thought on “Understanding floods: A look inside a classroom”
Comments are closed.
Excellent project…Congratulations to Ms. Harmon, students and all who worked on this project producing valid ideas.
May I suggest another solution…? dams! Hydroelectric production would help alleviate the stress on electricity availability and insure control of extreme rainfall/flooding. You might study the effect of Lake Cumberland, Kentucky Lake; the TVA dam system installed down the East Tennessee valley; and the system of hydro electric dams on the Catawba River through the foothills and piedmont of North Carolina.
In 1916, my town of Hickory, NC and neighboring towns and villages including Asheville, were mostly wiped out by the Flood of 1916 which has recently been compared to the Flood of 2024. After that event, Duke Power began installation of dams on the Catawba River which is located in the eastern continental divide and collects all of the runoff from the northwestern Blue Ridge Mountains. Additionally, the lakes provide the fresh water supply for much of this area and provide popular recreational options for North Carolina. The dams and created lakes begin at the mouth of the Catawba near Old Fort, Lake James, Lake Rhodhiss, Lake Hickory, Lake Lookout, Lake Norman (the largest and also equipped with a nuclear station, McGuire), Mountain Island Lake, Lake Wiley, and on into South Carolina with the Catawba Nuclear facility. I include this information to say that Duke Energy saved much of my area from the Flood of 2024 although every dam had water going over the top as well as through the spillways. Levees are great but the long range effect of the cycles of weather might suggest dams as a more certain option as recently observed on the Catawba.
Other ideas to consider might include intensity of rainfall (2 inches per hour with Helena); the lingering effect of storm (Helena sat upon western NC for most of two days); the influence of the high and low pressure systems on the storm areas;
An enjoyable read about the work of Ms. Harmon and students who I congratulate as forward thinkers!