Is there a map that shows the distribution of the three major rocks types—igneous, metamorphic, and sedimentary—around the world?
Our TecRocks team asked this question while trying to find real-world phenomena to engage students in the exploration of environments related to rock genesis. It seemed like a map like this should exist. Our hope was that students might be able to discern patterns in rock distribution, such as how basalt, an igneous rock, makes up the rock formations beneath every ocean.
Geologic maps are fundamental tools for geoscientists. These maps tell stories about Earth. They illustrate relative ages and physical relationships of rock strata found in a region. They are beautiful and colorful visual representations of rock types and the geological periods when they formed, as well as the topographic features in a region.
Below is a geologic map of Massachusetts. You can see a North-South trend of the bedrock, where each color in the map represents a rock type. From the striped pattern on this map, geoscientists can surmise there were repeated continental collisions through geologic history that created the mountains of central and western Massachusetts. They can also point out how the sediments that make up the Cape (the brown part of the map that juts out on the lower right) are a result of an Ice Age.
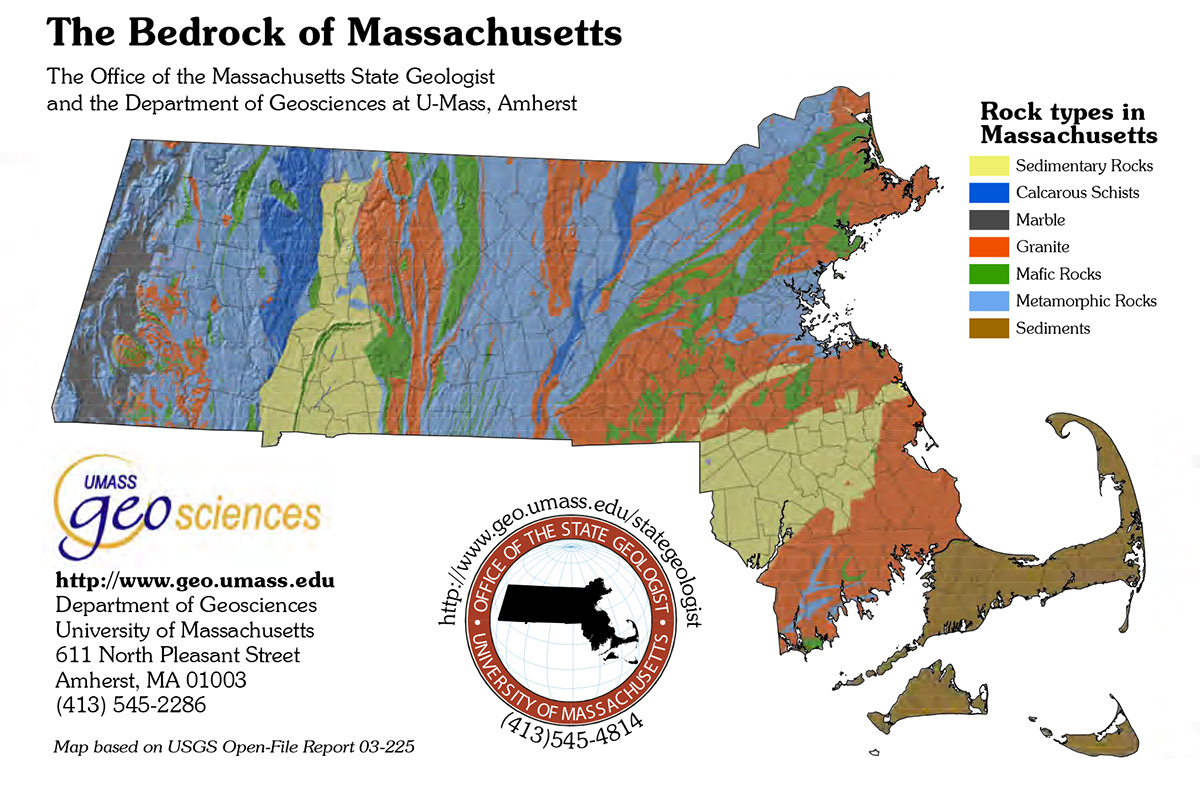
To be able to interpret maps like this, it is important first to learn where rocks are currently being made on Earth. The geological processes responsible for forming the myriad metamorphic, sedimentary, and igneous rock formations have not changed over time—the same processes taking place now have been happening for millions of years. For example, when continents collide and create mountains, metamorphic rocks form due to high pressure and temperatures. So we can use this to deconstruct the events that formed the metamorphic rocks represented by the blue stripes in Massachusetts.
The Massachusetts map is beautiful and instructive. But what about the whole world?
Faced with a search for such a map, the TecRocks team Googled. It seemed so simple. We were looking for a map that included the distribution of the three major rock types, but without all the geologic jargon, such as the geologic eras or the names of specific outcrops. Surprisingly, in our initial searches, nothing matched what we wanted. At long last, we came across a map produced by Sean Morrison. It seemed to be just what we were looking for. So we reached out to him to see if he might be willing to share it with us for use in our curriculum and if he had any others that would be helpful for our learning goals.
Fortunately, Morrison was extraordinarily generous about sharing his map and was willing to work with us to create additional maps specifically to match our needs. He is a professional river scientist and amateur mapmaker. Morrison’s map obsession began on family road trips when his family piled into their RV, DeLorme atlas in hand, and charted their course west.
During his undergraduate and master’s degree research, he studied modern and historic coastal processes in the Great Lakes. For the past five years, he has worked on river restoration projects located in the wilds of the Northwoods and the center of some of the world’s largest cities. He continues to create and share a wide variety of maps on Instagram, Twitter, and Facebook at @mapping_gnome.
We asked Morrison if he would be able to create “simplified maps” of rock distribution that could help students connect tectonic environments to rock genesis. His enthusiastic reply came back. “Sure, that sounds like a great challenge.” We were ecstatic.
In order to create the maps, Morrison scoured the Internet for worldwide geologic datasets. Though initiatives like OneGeology provide access to a wide variety of geologic datasets, most are limited to individual countries and focus on a scientific audience. Morrison combined three datasets to create a series of maps for our online curriculum module. The first dataset is used to show rock distributions at a global scale and is based on data published by Dürr et al. (2005). The second dataset is used to show rock distributions at a regional scale using data published by Hartmann and Moosdorf (2012). This dataset combines national geologic datasets into a single, seamless dataset showing world rock distribution at a very fine detail. Finally, Morrison used data provided by Blue Habitats to determine rock types below the ocean surface.
For each dataset, it was necessary to translate the scientifically focused data to something consumable by middle and high school students. For instance, the data published by Hartmann and Moosdorf (2012) contained 3 levels of lithological classification with 16 classes and 26 subclasses containing specific rock attributes. This data needed to be translated into the eight rock types that would be used in the final set of maps and would match the TecRocks Explorer model developed for the project. Morrison’s geology background was critical in accurately interpreting and translating the geologic data into a form for students.
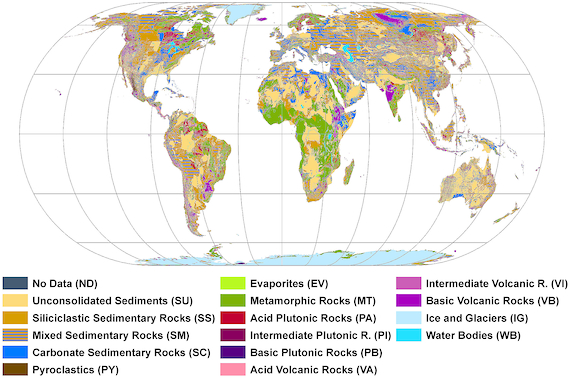
Untranslated data from the Hartmann and Moosdorf (2012) database.
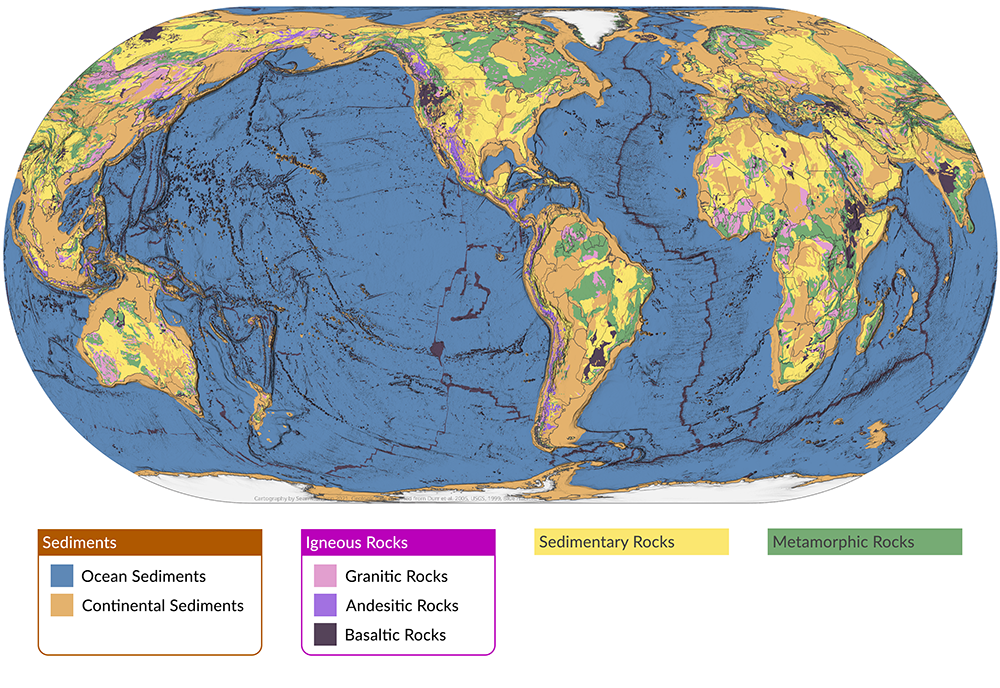
We are thrilled with the maps he has created for us. This first map is a world distribution map of igneous, metamorphic, and sedimentary rocks.
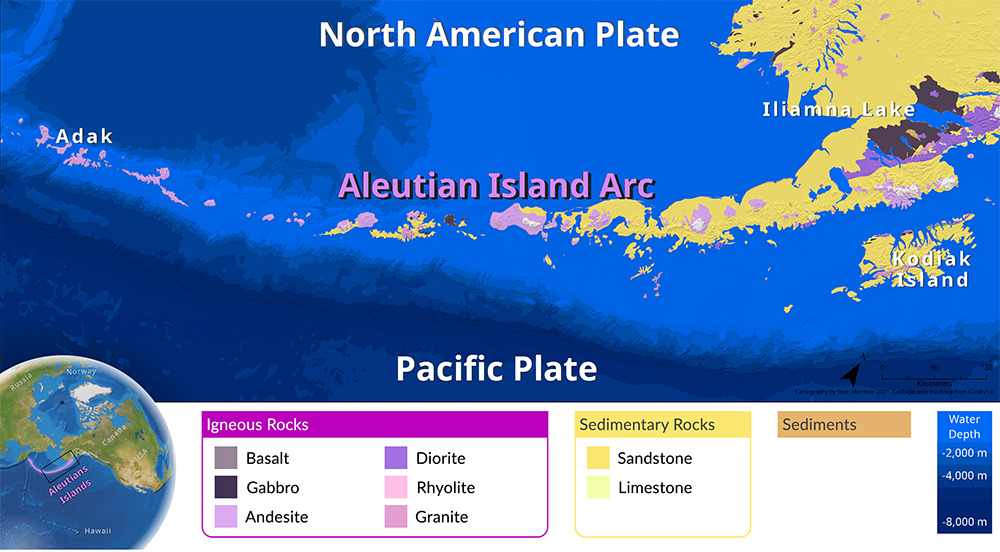
The map below shows a zoomed in version of the Aleutian Islands, where students can see igneous rocks responsible for this island arc along with sediments deposited from erosion near these islands.
We are in the process of adding these maps into a module that explores the connection between tectonic environments and where rocks form. We hope that the maps, along with our TecRocks Explorer dynamic model of plate tectonics and rock genesis will help students explore Earth’s complex systems.
If you are interested in field testing the curriculum module, please sign up here.
References
Dürr, H. H., Meybeck, M., & Dürr, S. H. (2005). Lithologic composition of the Earth’s continental surfaces derived from a new digital map emphasizing riverine material transfer. Global Biogeochemical Cycles, 19, GB4S10, doi:10.1029/2005GB002515
Hartmann, J., & Moosdorf, N. (2012). The new global lithological map database GLiM: A representation of rock properties at the Earth surface. Geochemistry Geophysics Geosystems, 13(12). Q12004. doi:10.1029/2012GC004370