From climate reports to historical datasets about income or education level, data influences how we understand and interact with the world around us. While math and science classrooms often shoulder the responsibility of teaching data skills, social studies classrooms are uniquely positioned to offer a context-rich and interdisciplinary approach to data literacy.
At its core, social studies is about understanding people, societies, and the forces that shape our world. Data—for example, demographic statistics, immigration trends, and agricultural records—is an invaluable tool for interrogating these dynamics. Data literacy is becoming a cornerstone of informed citizenship and necessary for navigating and enacting change.
By embedding data into social studies, teachers can equip students with the skills and mindsets they need to engage thoughtfully and meaningfully with societal issues. Integrating data into social studies allows students to interact with authentic datasets that foster a multidisciplinary approach, mirroring the interconnectedness and messiness of the real world.
In our Contextualizing Data Education via Project-Based Learning project (DataPBL for short), we worked with middle school social studies and humanities teachers to integrate data practices and dispositions into their existing EL Education curriculum modules. The data-infused modules culminated in student projects that addressed themes in social studies while using data to tell stories about the world.
DataPBL project staff curated a number of different datasets to use in the modules, including the existing U.S. Census Microdata CODAP plugin. Teachers also expressed interest in data from additional large, publicly available datasets. To meet this interest, DataPBL created two new CODAP plugins that make it easier for students to access data from the National Agricultural Statistics Service (NASS) and the World Health Organization (WHO). Next, we provide an overview and an example activity for each plugin.
The National Agricultural Statistics Service (NASS) plugin
NASS is located within the United States Department of Agriculture and conducts hundreds of surveys every year covering virtually every aspect of U.S. agriculture across food production, labor and wages, and farm demographics and economics. While NASS collates all of these surveys and makes the data publicly available through their website, navigating this massive data network is difficult for teachers and students. We developed a NASS plugin for CODAP that focuses on specific attributes relevant to middle school social studies while still maintaining student autonomy through providing some choice of attributes.
Example activity using NASS plugin
An 8th grade social studies teacher asked her students, “What trends can you see about farm demographics across the United States?”
You and your students can follow along.
First, open the NASS plugin and click the Attributes section. Choose some or all attributes within Farm Demographics across all 50 states. Under Years, select 2017, the most recent year released for the full demographic survey within NASS (Figure 1). Click Get Data.
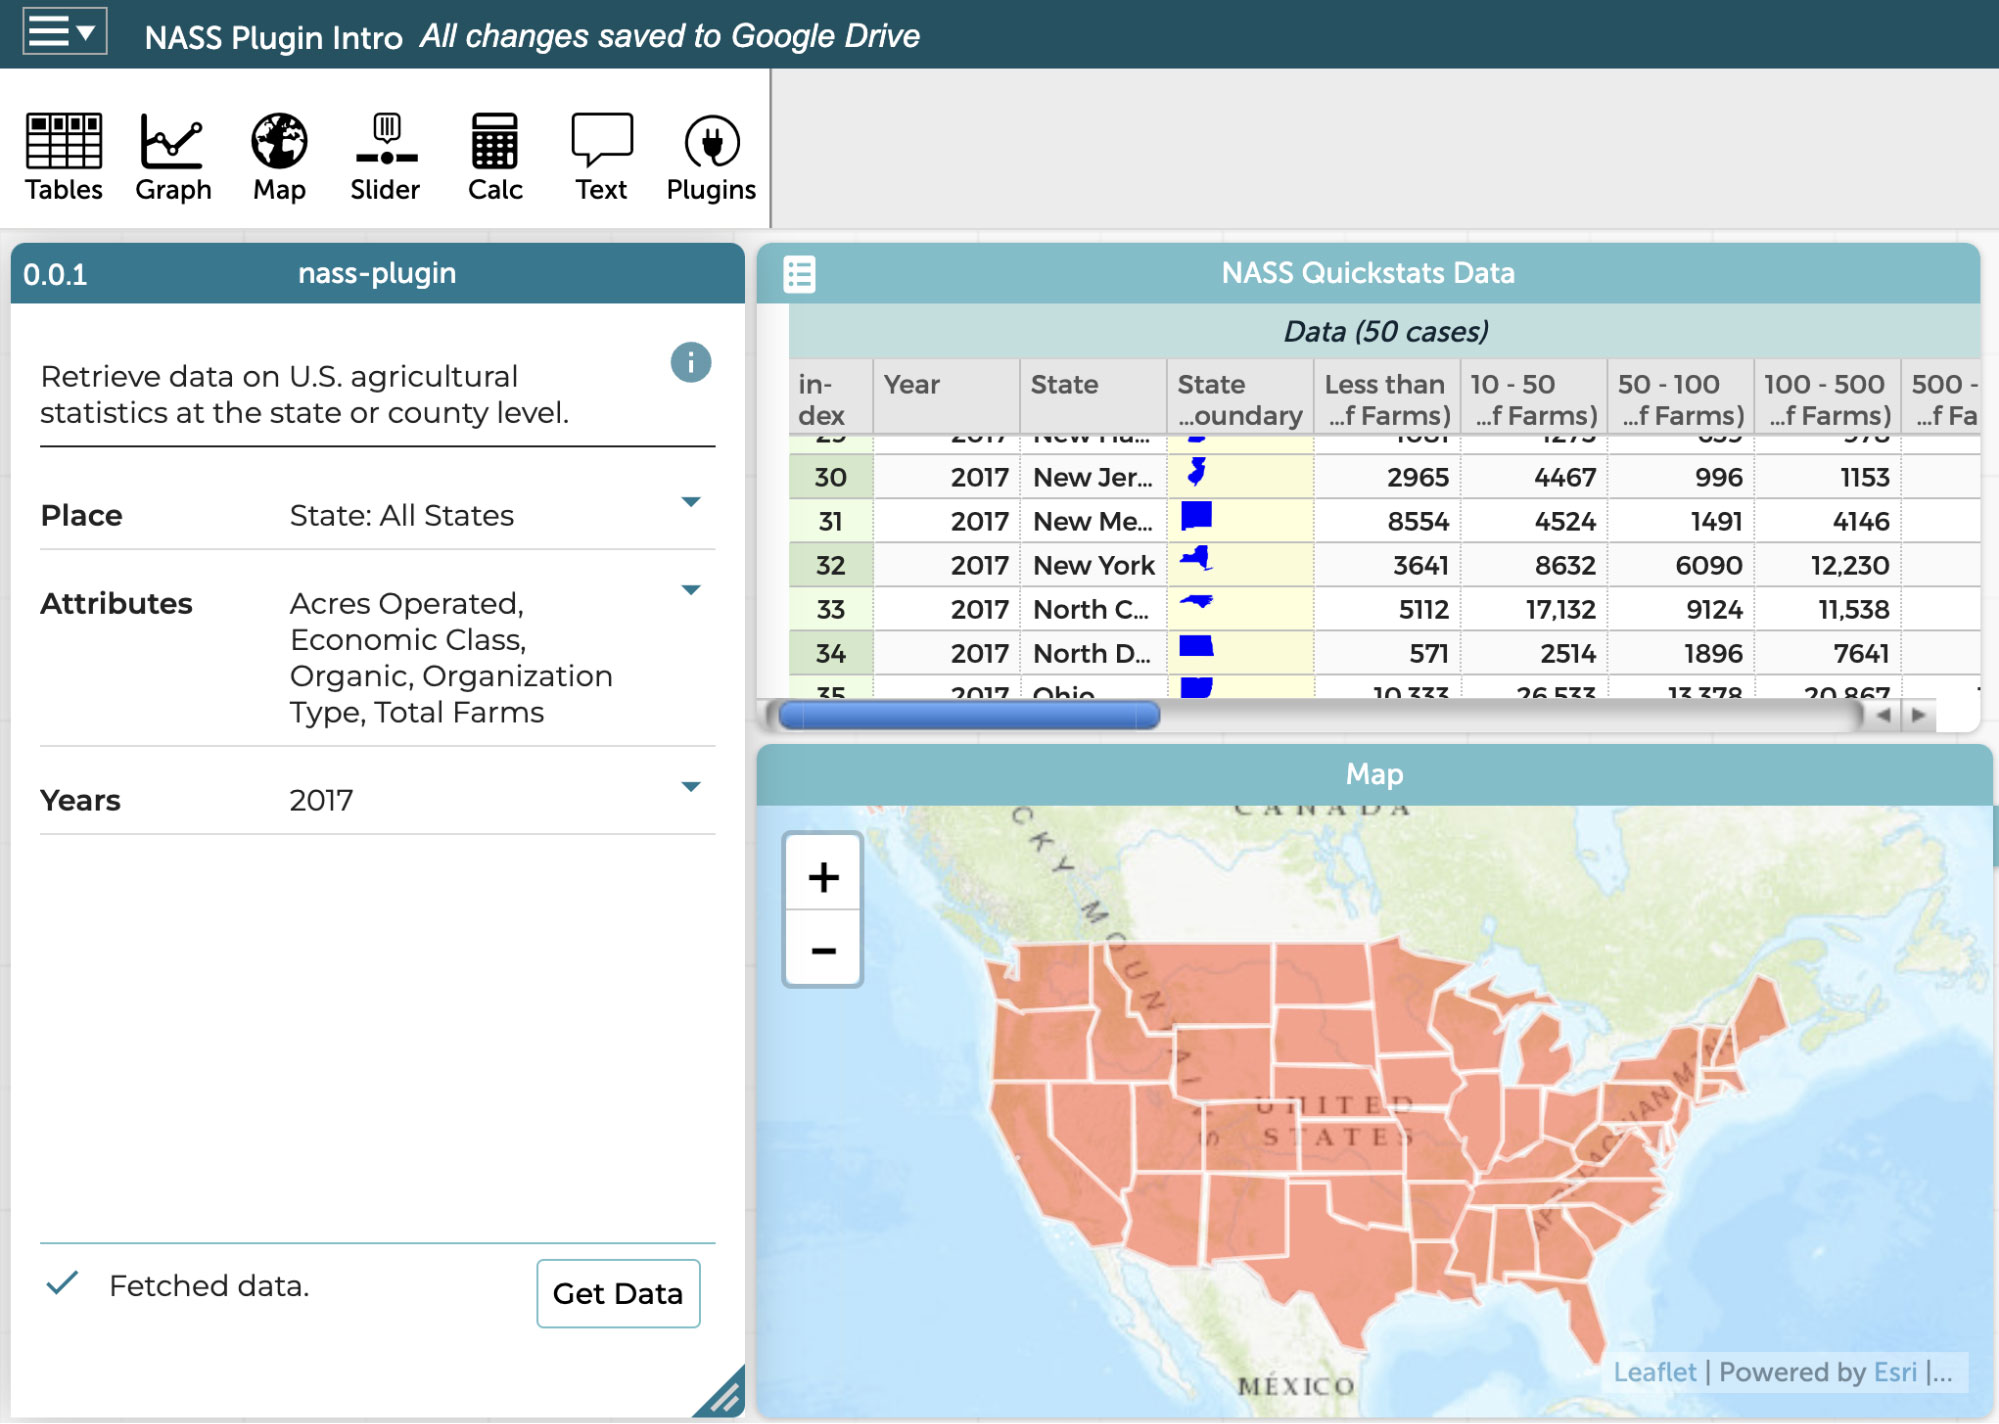
Figure 1. The NASS plugin with a data table showing attributes about Farm Demographics.
Next, click the Map button in the CODAP menu, and drag the “Total Number of Farms” attribute on top of the map (Figure 2). (Use the plus button in the map to zoom into the U.S., then drag the map to center the U.S.)
What do you notice? What trends are connected to what you know about agriculture policy in the United States?
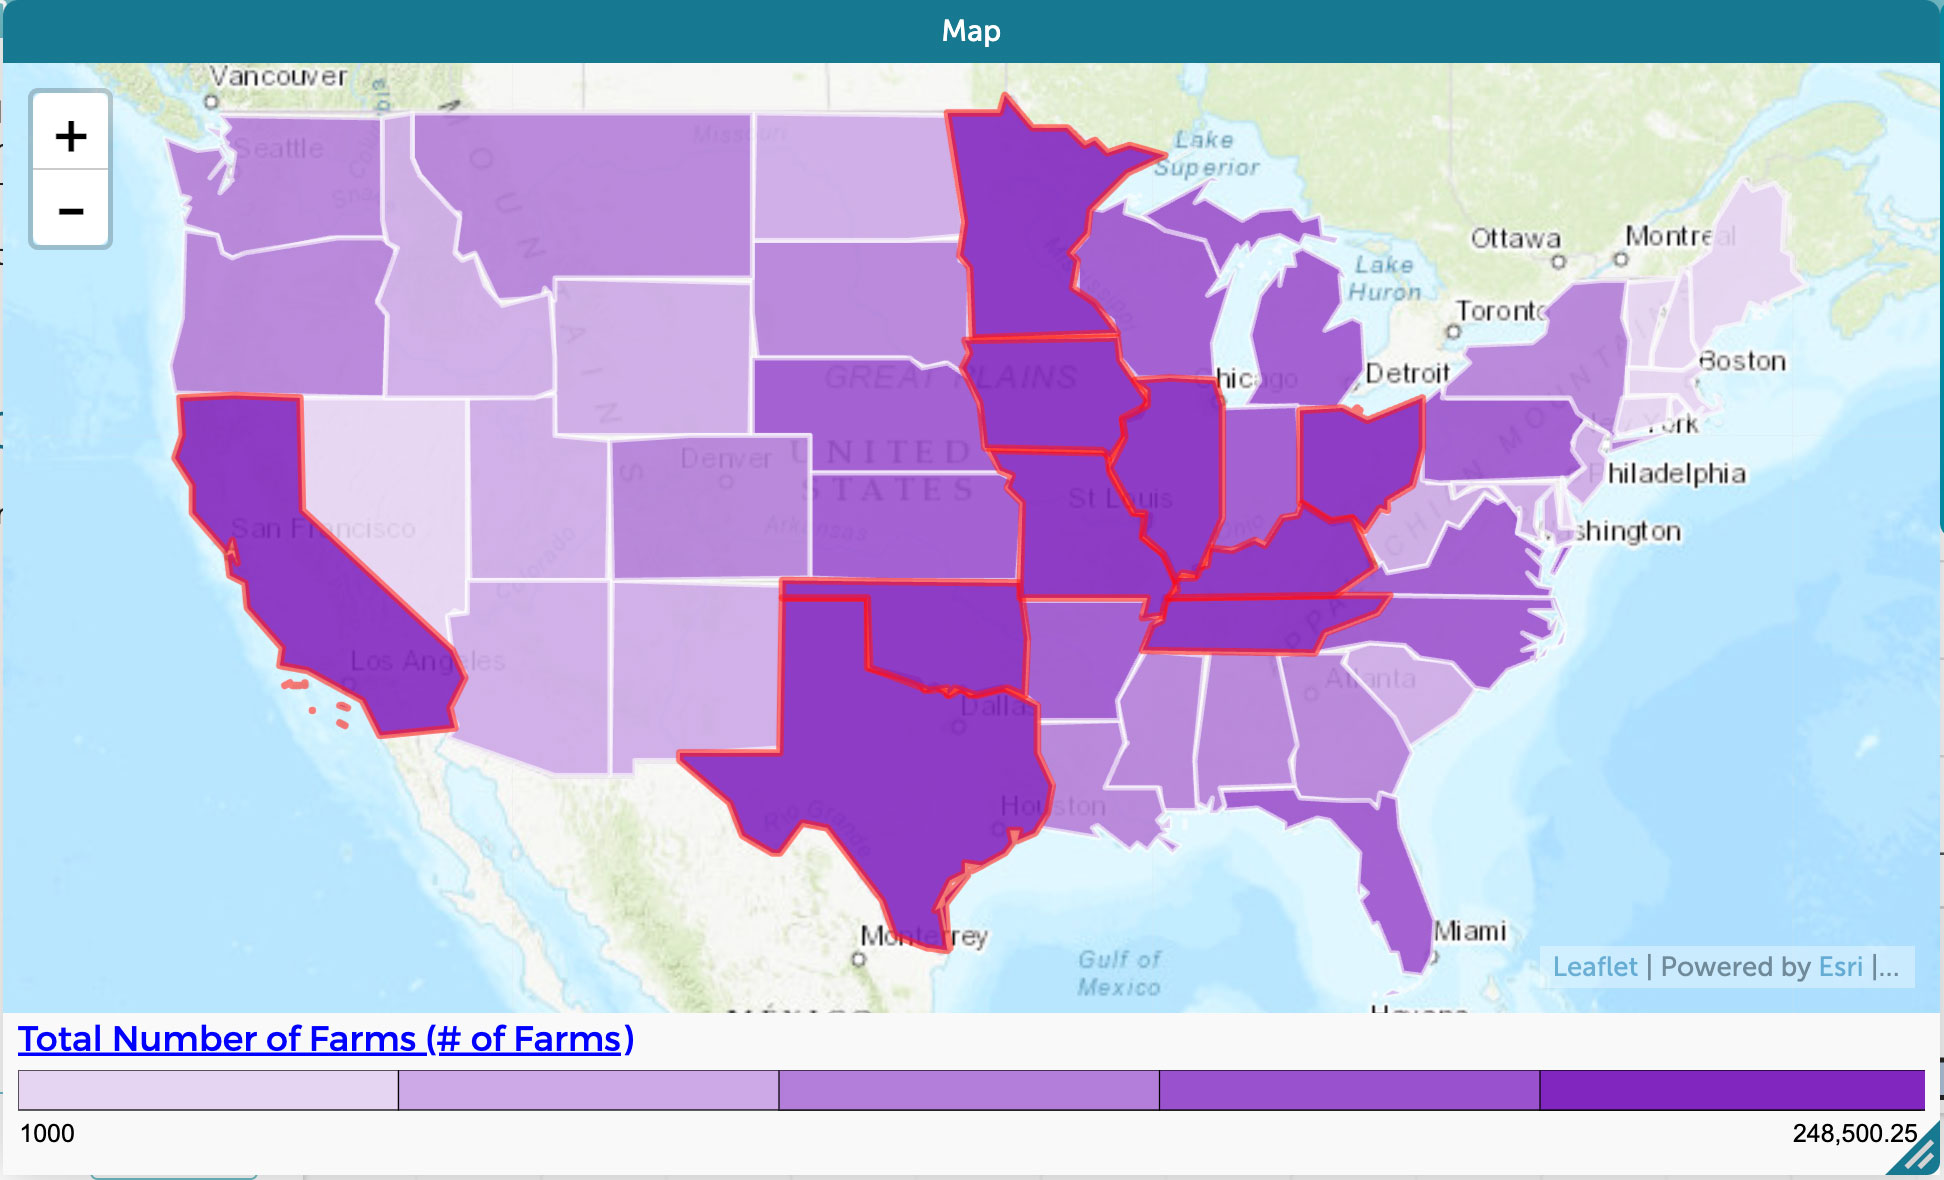
Figure 2. Total number of farms with a color distribution. (Change the color distribution by selecting the layers menu in the tools palette to the right of the graph.)
Create a graph with “Total Number of Farms” on the x-axis. (To do this, click Graph in the CODAP menu, then drag the attribute header “Total Number of Farms” in the table to the x-axis.) Select an attribute of interest and drag it to the y-axis. Now drag “State” to the middle of the graph, which will serve as a legend (Figure 3). Look for outliers.
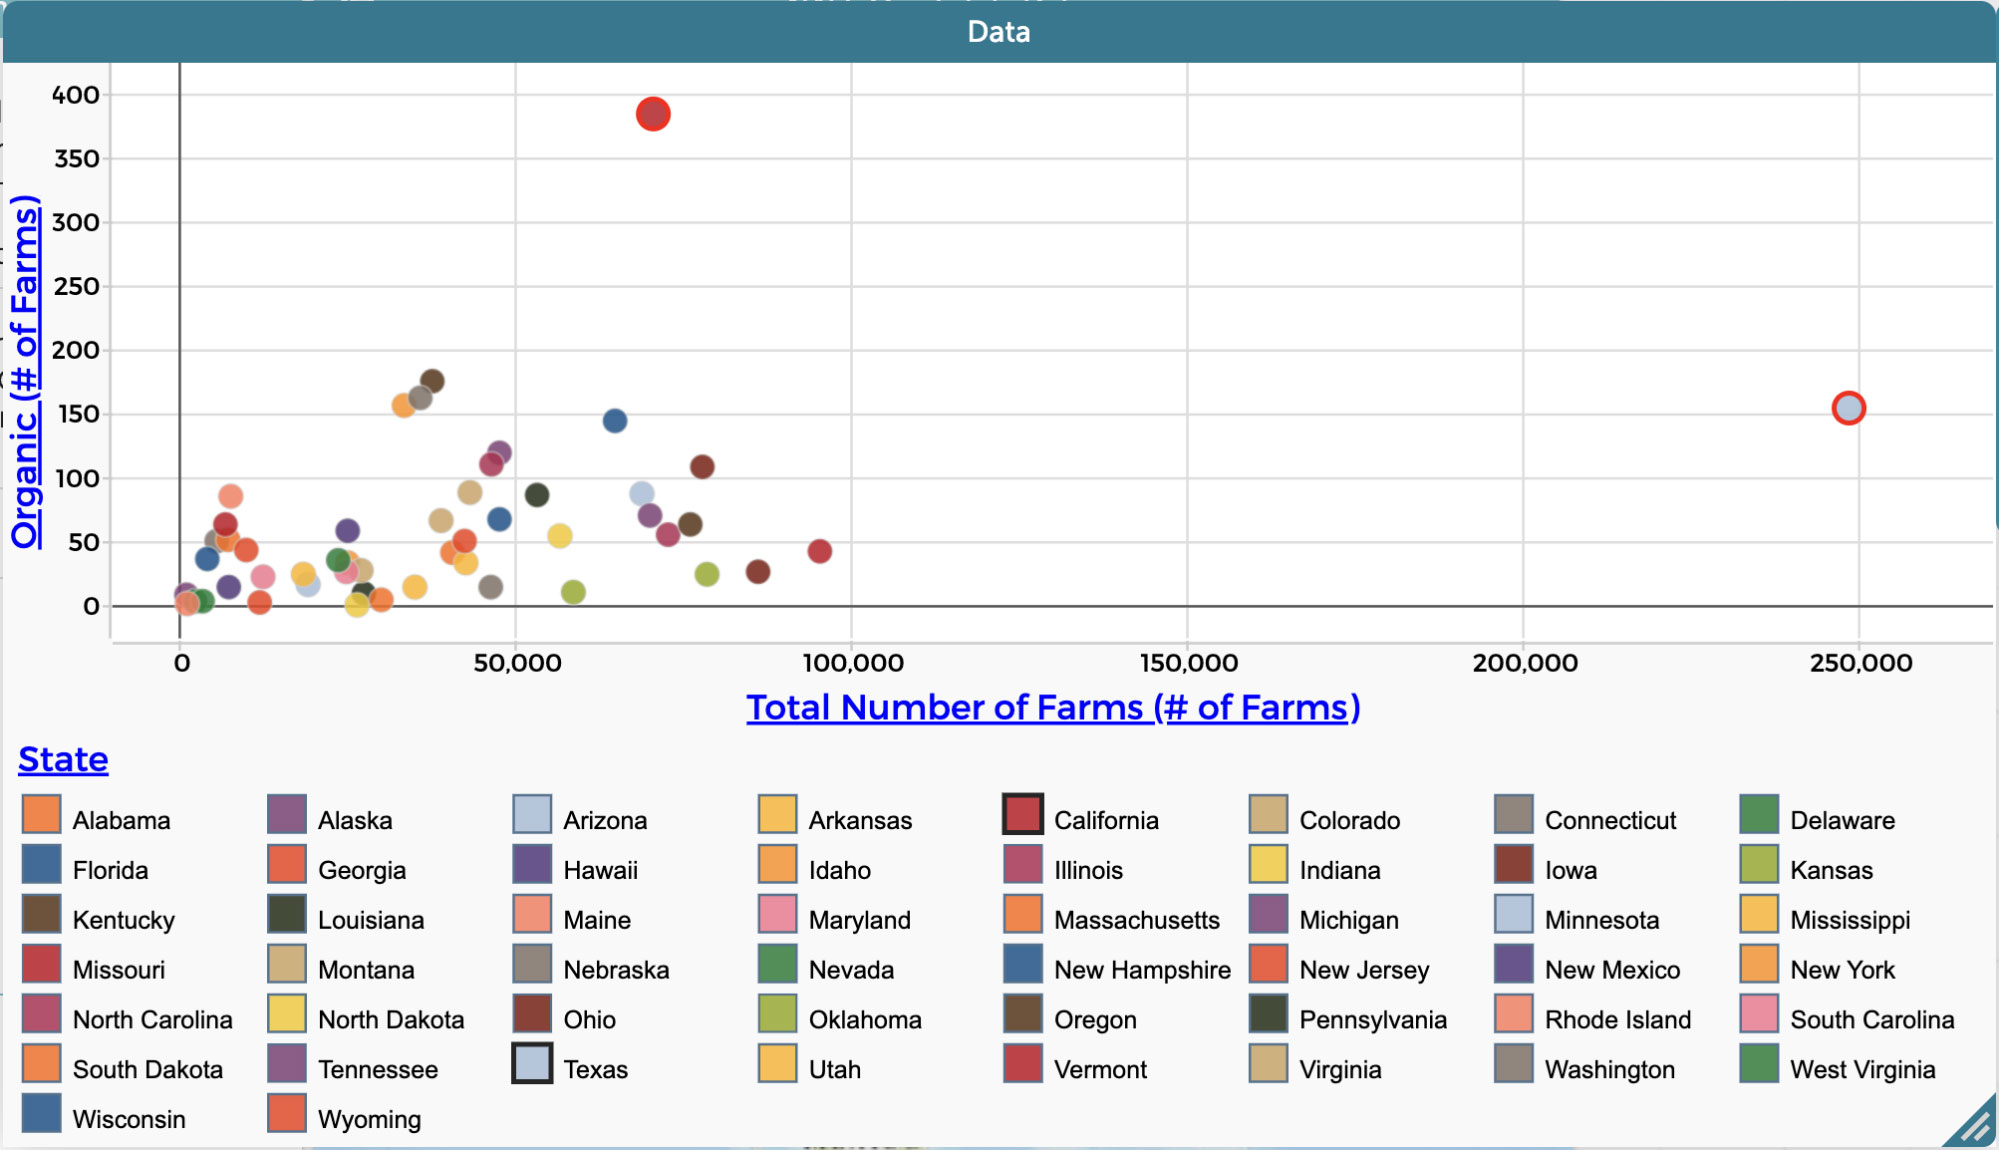
Figure 3. Total number of farms vs. organic farms by state. The outliers of Texas and California are both selected, highlighting the largest number of farms and organic farms respectively.
In our DataPBL teacher’s 8th grade classroom, students were asked to make connections between their exploration of the NASS data and The Omnivore’s Dilemma, which they were reading in their English class, and to think about ways that U.S. policy might affect the trends they saw in the data.
What did you learn? What are you still wondering about?
The World Health Organization (WHO) plugin
The WHO is a United Nations agency focused on studying health across the globe, promoting quality health care, and coordinating global efforts to increase access to good health across all nations. Through their efforts to study and expand access to health care and coordinate the world’s response to health emergencies, the WHO serves as a center point for health data throughout the world.
Unlike many other agencies, the WHO does not have a central hub for all of its datasets, making navigating and collating the data complicated. In response, DataPBL developed a WHO plugin for CODAP that focuses on specific attributes relevant to middle school social studies and science.
Example activity using WHO plugin
In order to explore the question, “How might food choices and access to food in the U.S. affect our health?,” the same 8th grade social studies teacher asked students to consider obesity and health. She began by having students choose 10 countries they wanted to compare, and select all available yearly data.
She then prompted students to create a graph with year on the x-axis and obesity in adults on the y-axis. By adding country as a legend, students were able to examine obesity trends in their chosen countries over time (Figure 4).
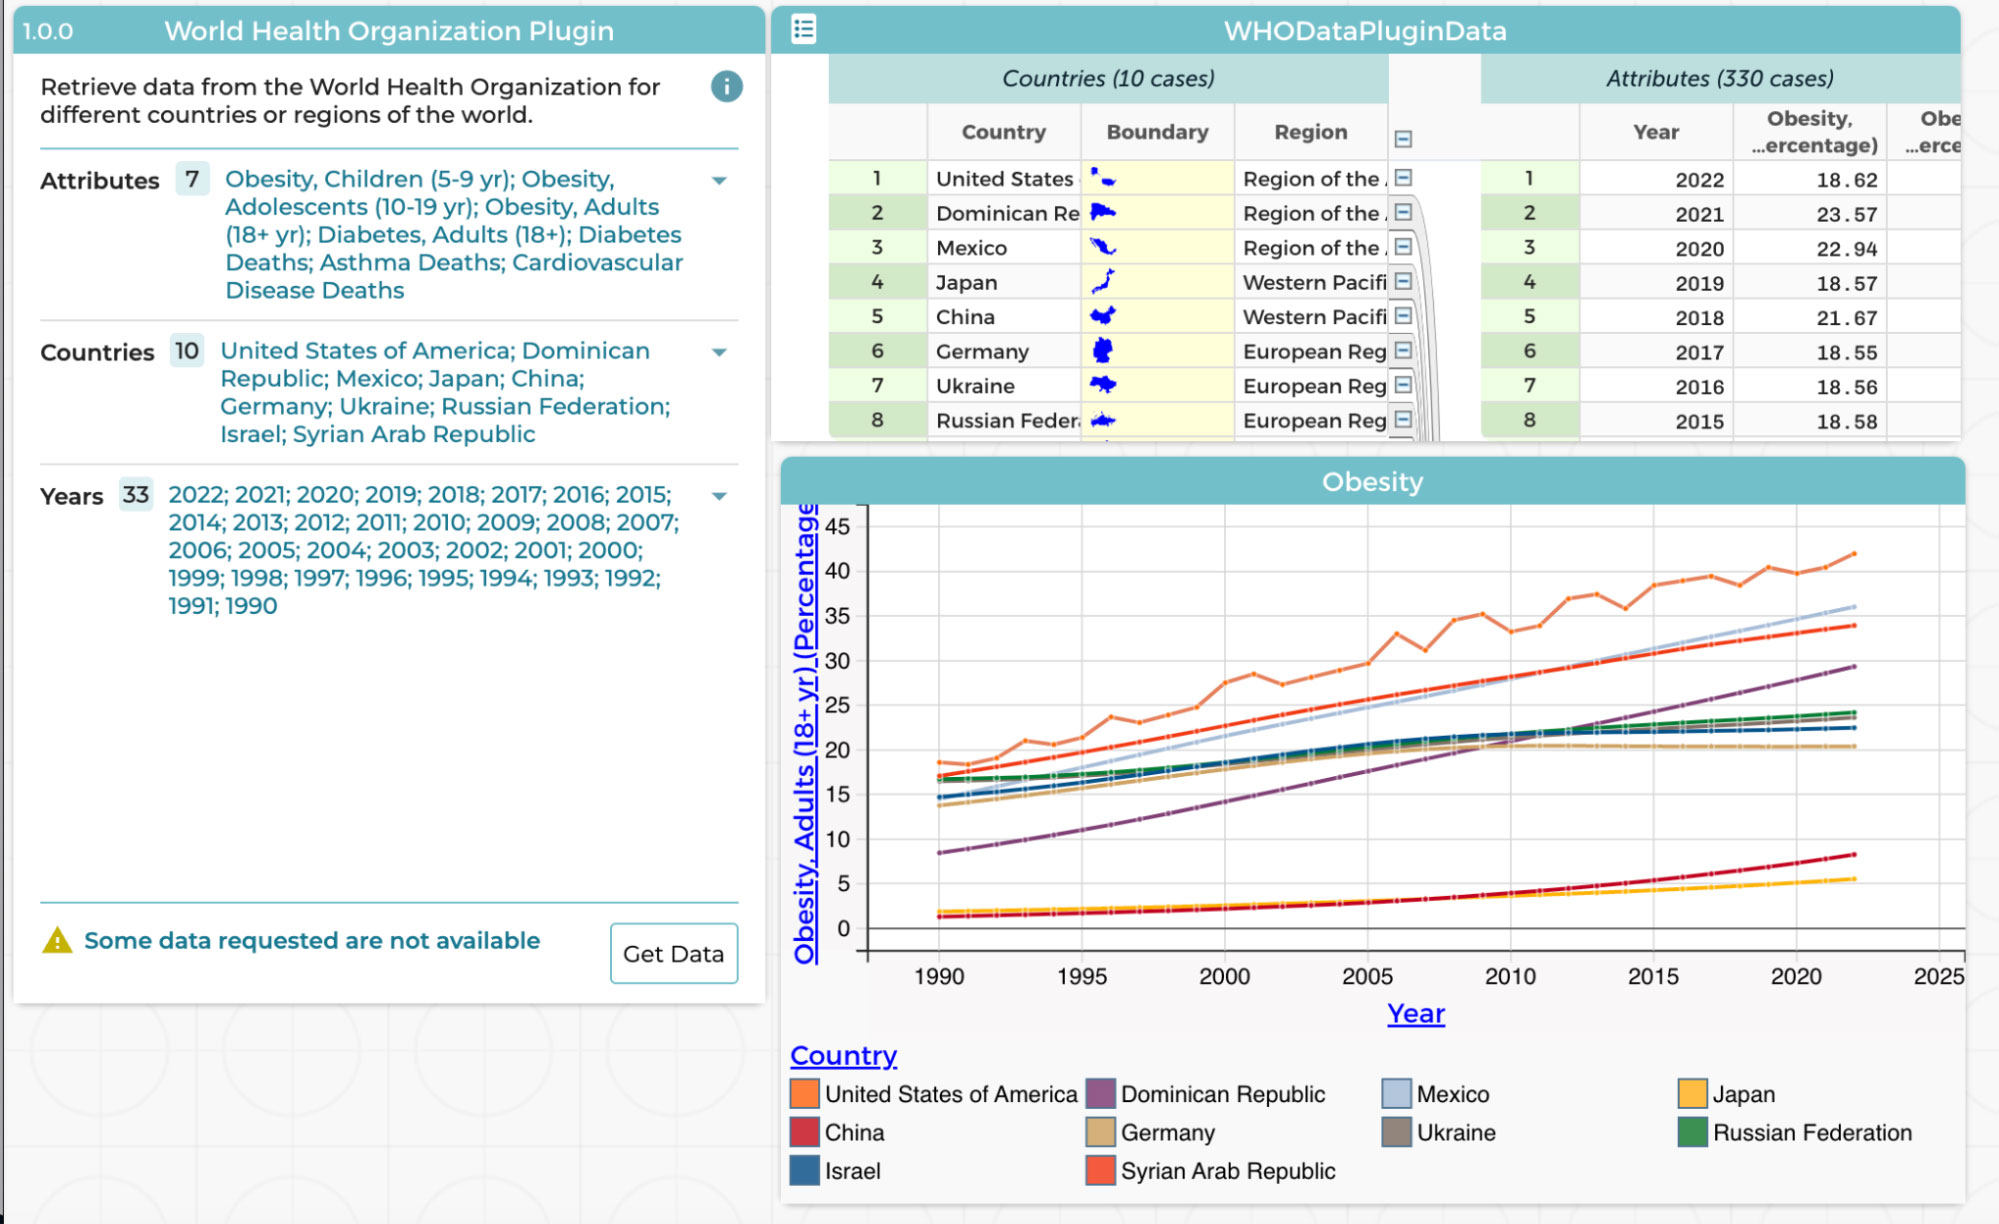
Figure 4. Using the WHO plugin in CODAP, students explored obesity trends around the world.
Important trends to highlight during this exercise include the leveling off in many European countries compared to the continued rise in many North American countries, including the U.S.
In order to explore a wider range of countries, the teacher had students “Get Data” from the plugin a second time, this time focusing on all countries, but only the most recent year of 2022. This allowed students to view obesity trends on a map and observe trends across regions (Figure 5).
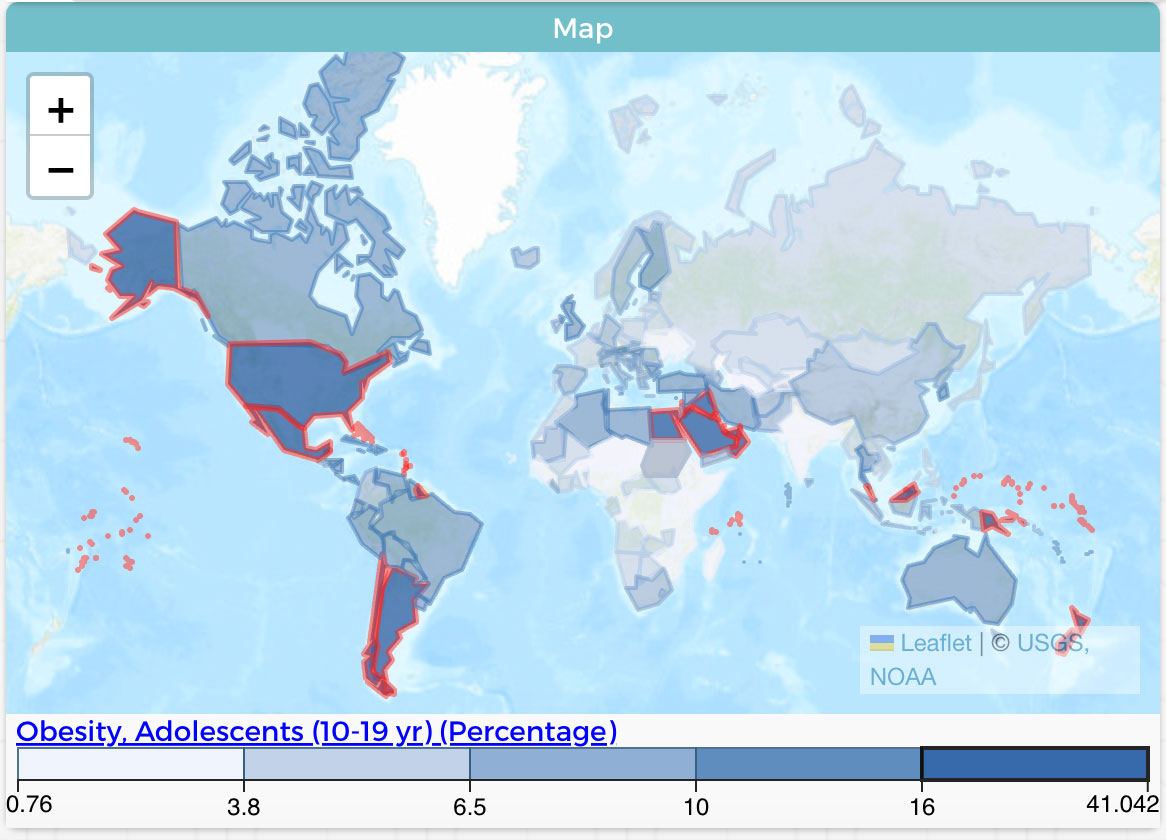
Figure 5. Map of obesity in adolescents across the world in 2022.
These two sample lessons were part of a larger project in an 8th grade social studies classroom in which students explored many different datasets, combined with information on U.S. health, food, and agriculture policy in order to write a bill proposal to address an issue within one of those areas. The project culminated in a mock congress in which students presented and voted on the bills with their peers.
These two data plugins provide a breadth of data for students to explore in their social studies classroom. With more data at their fingertips and tools to explore trends, make connections, and take evidence-based actions, students can engage in local and global issues they care about.
2 thoughts on “Exploring data in social studies using two new CODAP plugins”
Comments are closed.
Hi there! I love these two new plugins. I would love to use them with my future elementary teachers in our math content class. Is there a way to access them via the plugins button on a CODAP file? It would be great to have it there with “Getting Data”. Thanks!
PS – I love the grouping of the Plugins in CODAP (e.g. “Getting Data”, “Storytelling”, etc.)!
Thank you for the feedback Bridget. We are working on having both added to the plugin menu within a CODAP file. I’ll keep you posted when that update occurs.