

Monday’s Lesson: Determine Stream Health
Fresh water scientists use several factors to determine the health of a stream, including the chemical and physical qualities of the water as well as the number and types of organisms that live below the water’s surface. In this activity, you determine the health of a virtual stream by making observations about habitat, identifying and counting macroinvertebrates, and performing chemical tests.
Select a study stream
Go to leaf-pack.concord.org
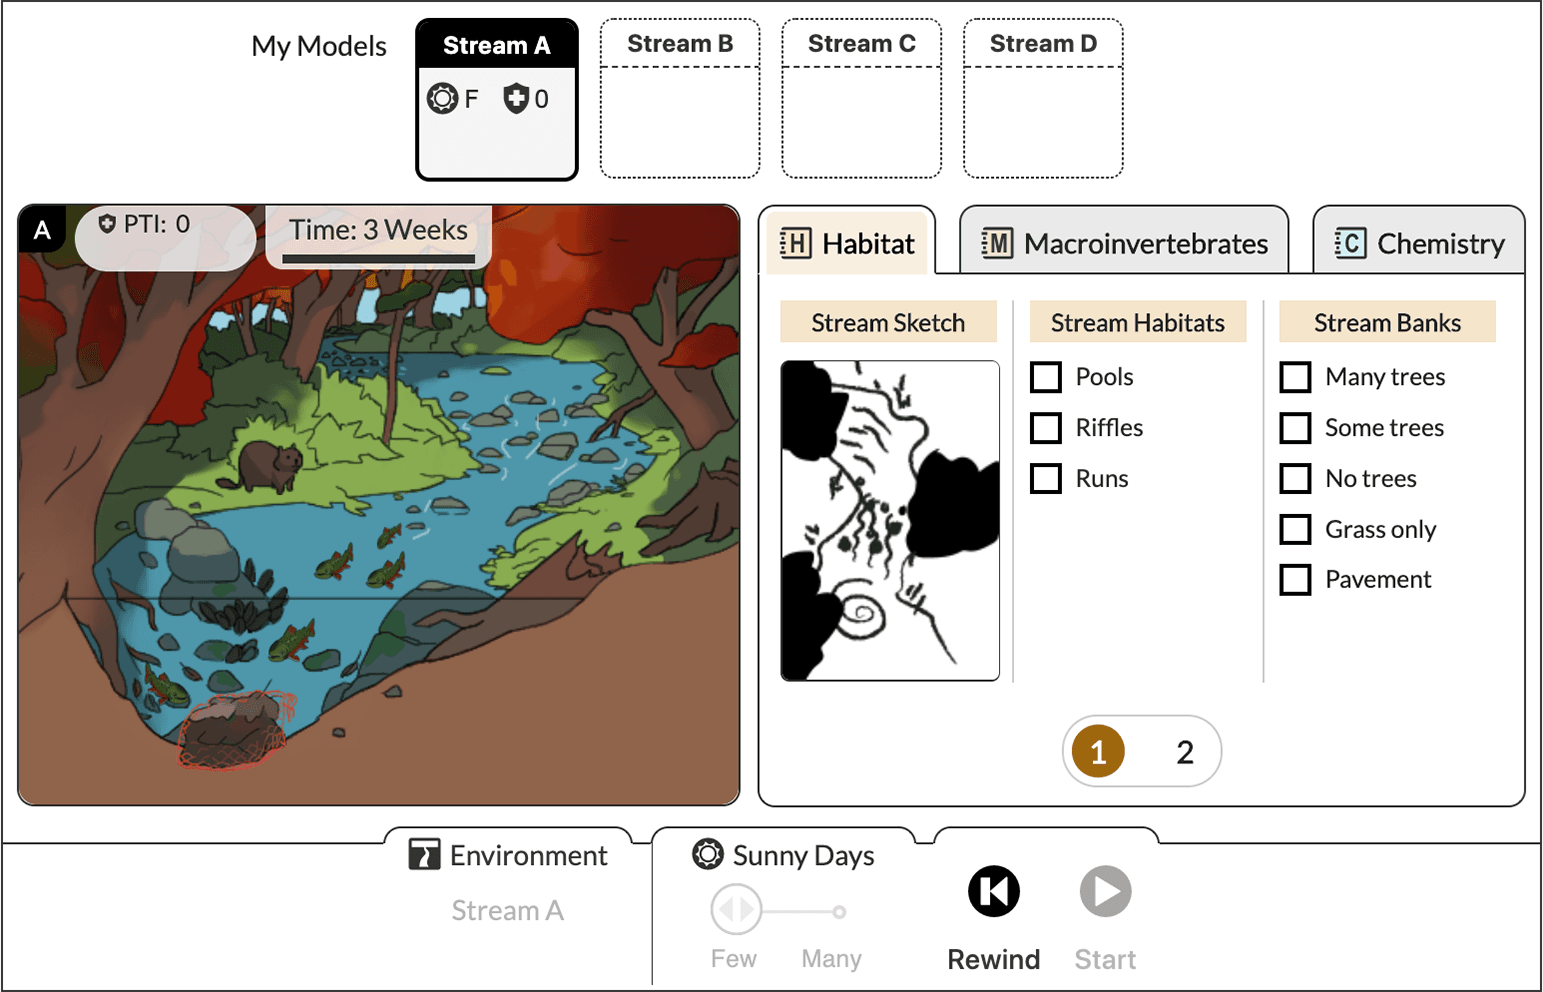
Select a stream by clicking one of the stream models (A, B, C, or D) at the top of the simulation. Notice the different features of each stream site and pick one that looks similar to a stream near you.
Describe the habitat
The habitat or area around the stream has a big impact on the stream’s health.
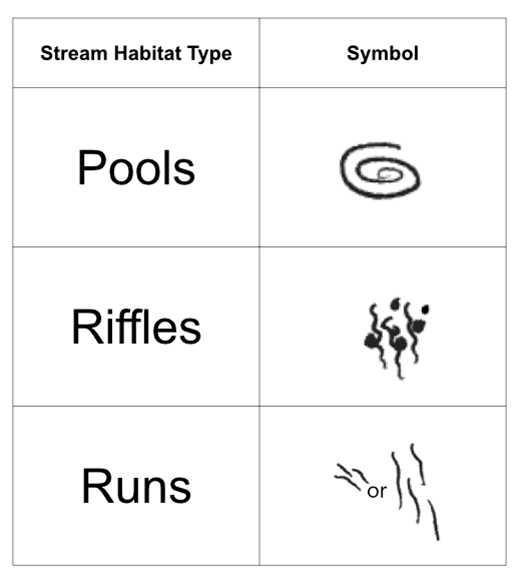
- Use the Stream Habitat Key to identify habitat features in the stream, and select the box next to each feature you see in the image (e.g., pools, riffles, trees, pavement, etc.).
- Click page 2 of the Habitat tab and continue to mark stream features you observe.
Identify macroinvertebrates
Certain aquatic macroinvertebrates are sensitive to pollution, while others are quite tolerant, so they are good indicators of stream health. To collect macroinvertebrates, scientists place packs of leaves in a stream, then collect them to see what’s feeding and living on the leaves. Each virtual stream contains a leaf pack.
- Set the number of sunny days in the bottom bar of the simulation (few/many), then click Start. It will run for a simulated three weeks until a Leaf Pack Sorting Tray appears.
- Click the Macroinvertebrates tab to sort and identify the macroinvertebrates. Click and drag all the leaves to a corner of the tray. Now click an organism, then drag and drop it into the correct box on pages 1-3 of the Macroinvertebrates tab to identify it. If the sorting is accurate, the organism remains in the box and a count appears for the total number of this type found. If not, the organism reappears in the sorting tray. Optional: Use a dichotomous key to identify the organisms.
- After identifying all the organisms, click page 4 to see the calculated Pollution Tolerance Index (PTI) from the stream’s biotic factors and the stream’s health rating.
- Close the sorting tray to observe the changes in the numbers and types of observable organisms in the study stream image.
Test water chemistry
- Click the Chemistry tab to run chemical and physical tests on a water sample.
- Follow the directions for each test.
- Select the number for each test in the bottom menu bar and click each step to watch the animated test. The results record automatically on the Home page.
- For tests with a color comparator (pH, Nitrate, Dissolved Oxygen), use the slider to match the color of the sample to the color chart. (Note: Be sure to select the best color match for accurate results. The simulation does not check the accuracy of the results.)
Determine stream health
Review the results from each tab. Are they all the same (poor, fair, good, or excellent)? How healthy is your stream? What makes the stream healthy or unhealthy? Test another stream’s health or complete a study on the same stream and change the number of sunny days to compare results.
Carolyn Staudt (cstaudt@concord.org) is a senior scientist.
Tara Muenz (tmuenz@stroudcenter.org) is the Leaf Pack Network Administrator at Stroud Water Research Center.
David Kline (dkline@stroudcenter.org) is a watershed educator at Stroud Water Research Center.
This material is based upon work supported by the National Science Foundation under grant DRL-1850051. Any opinions, findings, and conclusions or recommendations expressed in this material are those of the author(s) and do not necessarily reflect the views of the National Science Foundation.