Monday’s Lesson: Zoom In! Teaching Science with Data
In today’s data-driven world nearly all scientific discovery involves delving into data. The Next Generation Science Standards (NGSS) include “analyzing and interpreting data” as one of the key practices and emphasize the need for students to engage firsthand with authentic datasets. A new set of six high school Earth and life science units are now available from the Zoom In! Teaching Science with Data project at EDC, developed in collaboration with the Concord Consortium. In each online unit students use the Common Online Data Analysis Platform (CODAP) to explore and analyze one or more real-world datasets. Each unit includes a comprehensive teacher guide.
Note that you can get off to a good start with this lesson on Monday, but you’re unlikely to finish until Friday.
Population divergence: How are island lizards changing in the Skyros Archipelago?
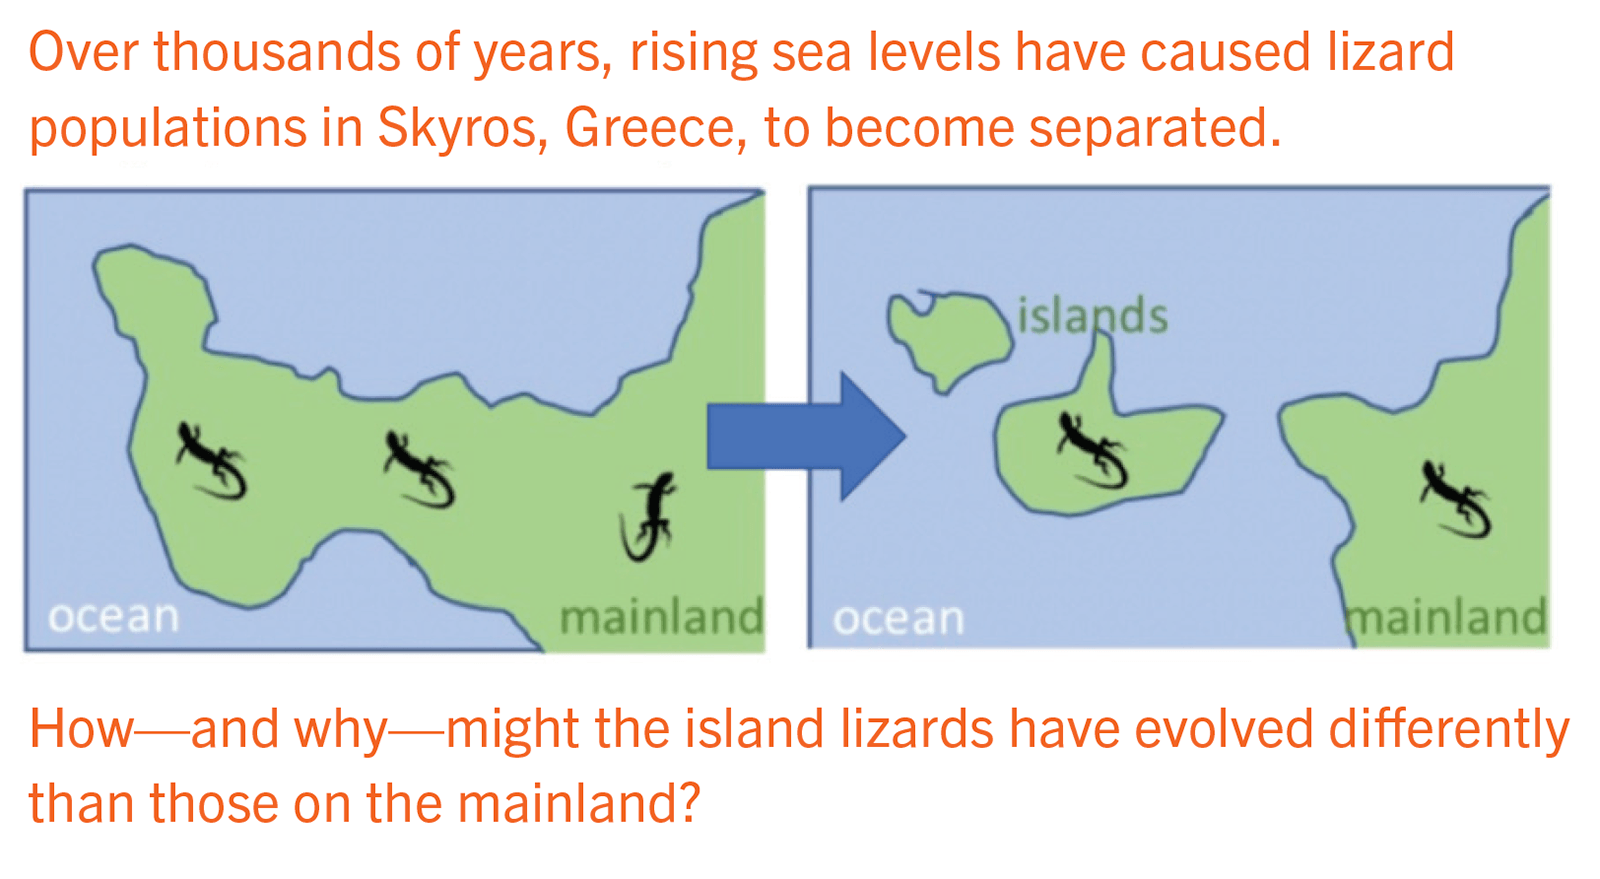
Natural selection is one force of evolution that brings about the formation of species. Organisms living in different habitats experience different environmental conditions, which favor the selection of certain characteristics in one place and different characteristics in another. This can result in distinct populations within a species, or even a split into new and different species. Working with data collected in the Skyros Islands in Greece, students discover the influence of predation on lizards living on islands compared to those living on the mainland.
Get started by going to: app.zoominscience.edc.org
Sign up as a student with access code CrimsonOxford663
1. The Hook
Brainstorm answers to the question: What happens when populations are separated?
2. Background
Students learn how selective pressures influence natural selection’s choices, how traits diverge during evolution, and how to measure evolutionary changes with mean and standard deviation. They also meet the researchers who collected the data and learn the methods they used to measure the lizards’ traits.
3. Data Orientation
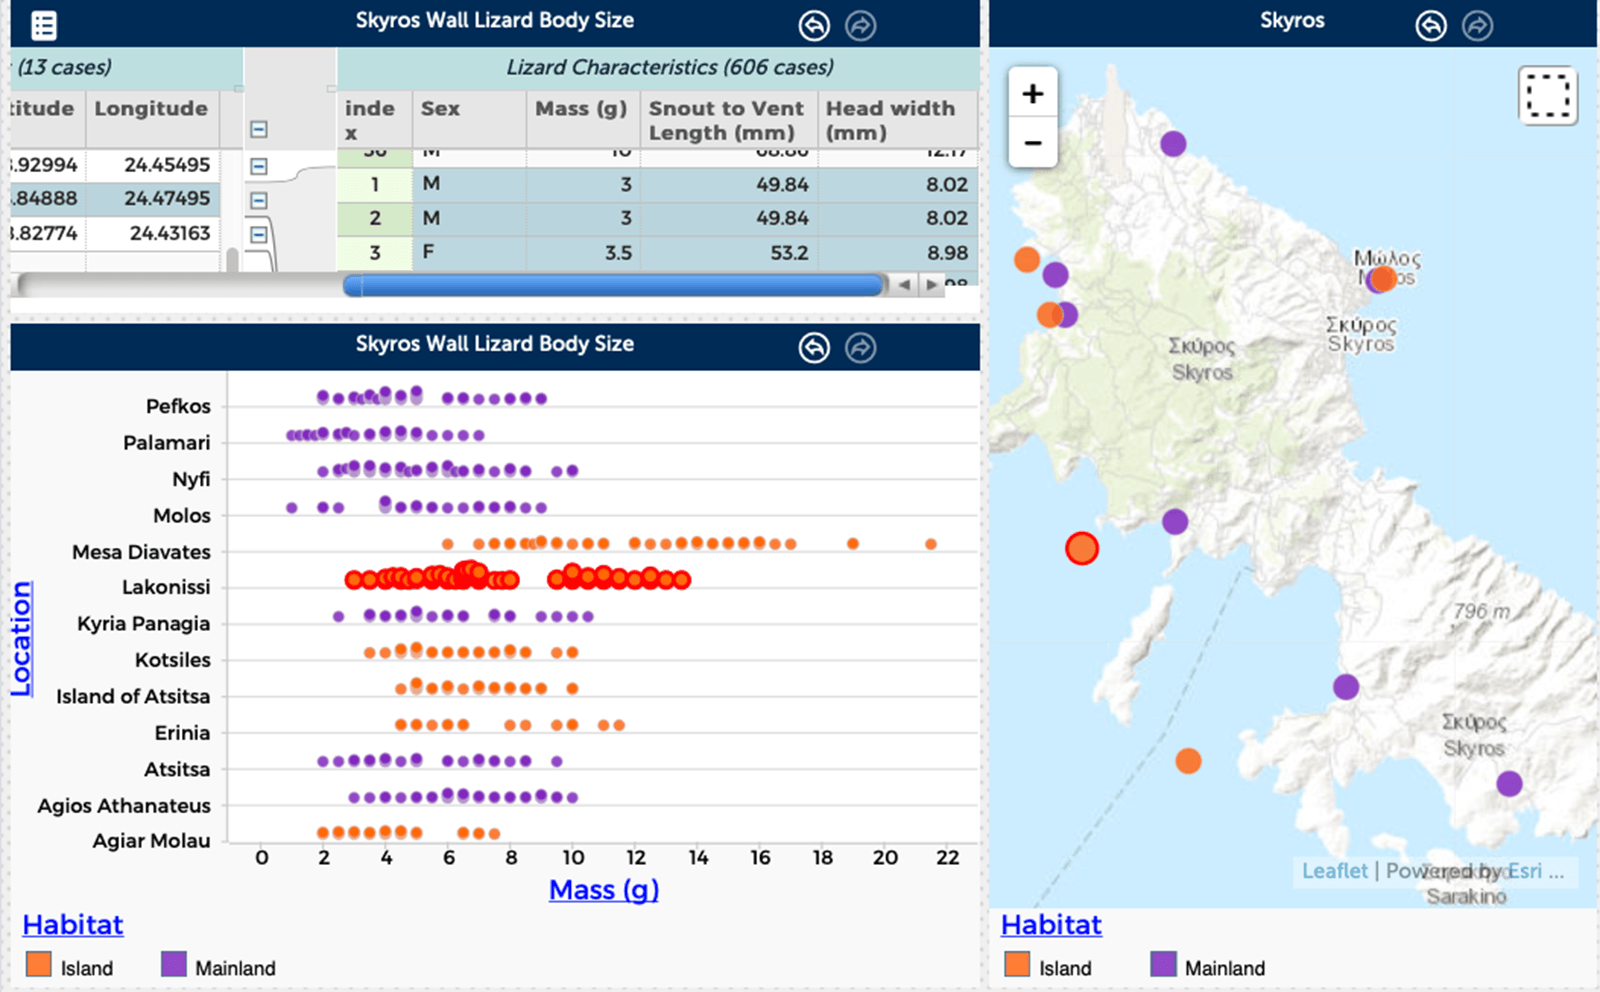
Use CODAP to explore data about lizards and to become familiar with the data structure and attributes. With 2 habitats, 13 locations, and 606 lizards, there’s a lot to investigate! Change graph displays by selecting different attributes from the data table and dragging to the x and y axes. Select points or rows to see how the same data appear in different representations: map, graph, and table. Allow students plenty of time in this stage to “mess around” as they learn CODAP’s features.

4. Investigation
Working in three groups, students examine lizard body size, alertness, and protective coloration. They make hypotheses, construct graphs, analyze the data for mean and standard deviation, corroborate results, and present their findings.
5. Writing Task
Students turn the results of their investigations into claims, evidence, and reasoning to communicate their answer to the driving question: How are island lizards changing in the Skyros Archipelago?
The other Zoom In! units follow the same five-part structure, providing multiple rich opportunities to analyze data and answer engaging questions just as scientists do.
- Where will we find the next Earth?
- Where will the next big earthquake hit?
- What happened when wolves were reintroduced in Yellowstone?
- How will polymorphic animals survive a changing climate?
- How is climate really changing?

Bill Finzer (wfinzer@concord.org) is a senior scientist.
Randy Kochevar (rkochevar@edc.org) is director of the Oceans of Data Institute at the Education Development Center.
This material is based upon work supported by the National Science Foundation under grant DRL-1621289. Any opinions, findings, and conclusions or recommendations expressed in this material are those of the author(s) and do not necessarily reflect the views of the National Science Foundation.
