Monday’s Lesson: Modeling Climate Change with MySystem
To make sense of science, students must develop their own mental models of the phenomena to glean what is happening. When making mental models—like diagrams of energy flow—it’s important to start simply. Refinements and nuances can be added later.


Developed at the Concord Consortium, MySystem is an online tool designed to help students diagram their understanding of particular science content. We focus here on energy, a crosscutting theme in middle school science. Students select from a palette of icons (e.g., Earth, sun, greenhouse gas) and drag them onto a canvas. They link these icons together with arrows and label the arrows to indicate what is flowing (e.g., sunlight, IR) as well as the direction of flow.
Modeling climate change
Try one of the following climate change lessons with your students, then use MySystem diagrams to elicit student ideas, and gauge and build their understanding.
Modeling Earth’s Climate – This five-day activity explores factors that affect climate, set in the background of Earth’s climate history.
Greenhouse Gases – This one-day activity focuses on the effect of greenhouse gases in the atmosphere.
As students run the activities, stop the class periodically and engage them in discussion. Have them build energy flow diagrams in MySystem and debate which one portrays the system more accurately. If disagreement arises (that’s how real science proceeds!), then send students back to the models to gather evidence and formulate arguments.
Challenges
We authored the icons and links in this MySystem diagram to illustrate the most significant energy flows in climate change. While the models in the above activities focus on interactions of energy with matter, the MySystem diagrams deal more abstractly with inputs and outputs: energy of sunlight flowing into the system, energy flowing out and the path it takes. These are two different ways of looking at Earth’s energy flow and they complement each other. For instance, the activity models show sunlight interacting with the Earth and sky, but don’t explicitly show the sun or outer space. MySystem can bring these essential elements to the fore.
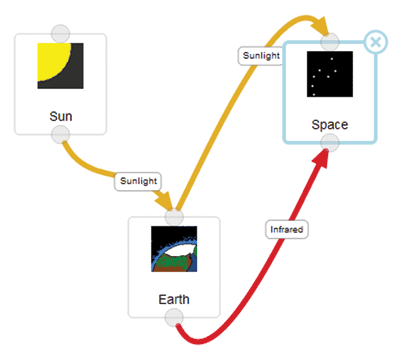
After students have a basic understanding of energy, challenge them to create a diagram that illustrates energy flow on any planet—with or without an atmosphere. The MySystem diagram in Figure 1 shows that the planet both absorbs the incoming sunlight and reflects some of it back into space. It radiates absorbed energy as infrared. The net change of energy on the planet is zero. All planets must do this or they would continue heating.
“What if?” scenarios
Once this basic energy model is established, try “what if” scenarios with your students. For instance, test their understanding of albedo by asking, What if the planet is perfectly reflecting or completely absorbing of sunlight? What if the planet has an atmosphere that contains greenhouse gases?
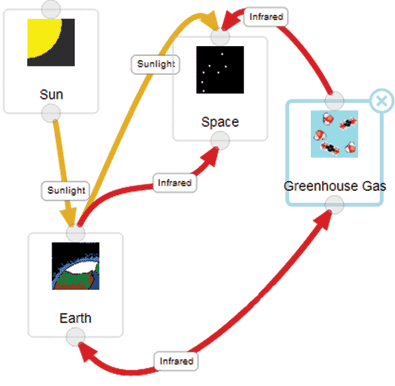
In Figure 2, the link from Greenhouse Gas to Earth is a double-headed arrow, showing that greenhouse gas circulates energy back to Earth, the cause of greenhouse warming. However, greenhouse gases also radiate energy into space, maintaining a zero energy flux.
What if clouds are added? Continue with “what if” questions to build a more complex diagram—and a more complete understanding of climate change.
Nathan Kimball (nkimball@concord.org) is a curriculum developer.
This material is based upon work supported by the National Science Foundation under grant DUE-1044263. Any opinions, findings, and conclusions or recommendations expressed in this material are those of the author(s) and do not necessarily reflect the views of the National Science Foundation.
