InquirySpace: A Space for Real Science
“Before graduating from high school, students working individually or in teams should design and carry out at least one major investigation. They should frame the question, design the approach, estimate the time and costs involved, calibrate the instruments, conduct trial runs, write a report, and finally, respond to criticism.” — AAAS Benchmarks

Student research is sometimes called “extended inquiry” to distinguish it from plain inquiry, which has come to mean learning through observing, questioning, thinking, communicating and collaborating. Inquiry is the best way to learn anything, but extended inquiry is in a different dimension because it starts with students defining their own questions and devising their own experiments.
While advocating student research when some kids lack basic science knowledge may seem quixotic, we don’t see it that way. We want students to understand science by doing their own research projects. The AAAS Benchmarks, NSES and the new Frameworks concur.
But this is a tall order. Teachers who want to support student research face major practical barriers as they traverse the chasm between standard cookbook labs and open-ended research projects. Their students may lack experimental skills and labs with general-purpose equipment. Teachers may feel unqualified to support student projects that venture into unfamiliar science content. And student research can take time and be difficult to assess.
InquirySpace is designed to provide significant help in bridging this chasm by offering tools and scaffolding that will make it easier for students to carry out their own research investigations. Five high school students recently participated in a daylong “inquiry camp” where we piloted these strategies. We share two encouraging anecdotes here.
A variable that didn’t vary
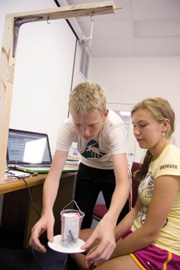
The first InquirySpace activity used a physical mass-spring system, a motion detector and a computer simulation of oscillating motion (Figure 1). One student team asserted that the mass affected the period of the physical spring-mass system because the heavier mass stretched the spring farther, so it had farther to go up and down and took longer. They investigated their claim by collecting probe data and graphing the period against the starting position of each run. Puzzled to find that the starting position didn’t make much difference, the students proposed that they hadn’t changed the amplitude enough. If there were bigger differences, the change in period would show up.
Next they switched to the computer model in order to try a larger range of starting positions, keeping other things constant. To their surprise, the period was absolutely unchanged, to the thousandths of a second! They concluded that the model was correct and that starting position didn’t matter.
Two paths to understanding
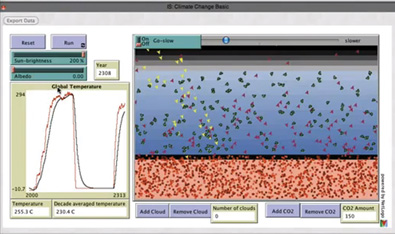
Later in the day, we presented a simple climate change model. The model computes the approximate Earth temperature as a result of changing the sun’s energy, the average albedo (the fraction of sunlight reflected), the amount of clouds and the concentration of CO2 in the atmosphere. We challenged the students to spend 45 minutes investigating the effects of these variables on the temperature of the Earth.
One team went for wild extremes. They discovered that they could fry the Earth if they increased sunshine, reduced albedo, removed clouds and added CO2 to the greatest values allowed by the model. The planet temperature soared to 284°C. Then they went the opposite direction. The graphs of their experiments were dramatic (Figure 2). When asked to summarize their results, they could explain the mechanism for each variable that resulted in increased or decreased Earth temperature.
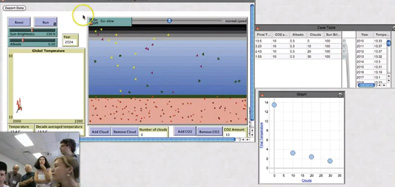
Meanwhile, the other team quietly and systematically explored each variable, one at a time. They made at least four runs of the same duration, changing just one variable each run and summarizing each series with four graphs showing the effect on temperature of sunshine, albedo, CO2 and clouds. The graph of the impact of clouds on temperature was strikingly non-linear (Figure 3). It was clear from their summary that they understood the graphs and were able to reason about the causes of the trends.
The two teams demonstrated opposite ways to understand a model: test extremes or systematically explore each variable. While the second team uncovered more detail, both teams learned the same ideas and all students experienced doing scientific research.

From camp to classroom
These informal observations indicate that we’re on the right track. Students were able to perform and summarize dozens of experiments quickly. They moved comfortably between real and virtual experiments and applied the same inquiry steps to both. And once they mastered the idea of collecting data from multiple runs and summarizing them, they easily went on to do their own investigations.

InquirySpace will provide a package of curricula and technologies with the following features that will allow many more students to experience real science in their classrooms.
Learning research by example. Students need to experience examples of doing research. Our inquiry camp showed that after exposure to the tools and methodology, students could go on to investigate their own topics.
More measurement capacity. Students need options for taking experimental measurements for their research. InquirySpace will support a wide range of probes and will provide ideas for making more. It will also provide flexible computer models, each of which will support dozens of projects.
Easy analytical tools. Having obtained lots of data, it can be overwhelming and time consuming to sift through them. Speeding up this process not only reduces the time required to do a project, it also facilitates learning by closely linking experiment to results. Data collected from probes and models is similar and automatically exported into an easy-to-use data exploration tool specifically designed for students.
Use graphs, not abstract math. Experimental research often relies on equations and advanced mathematical facility. To democratize research, InquirySpace relies exclusively on graphs. And while graph interpretation is also difficult for students, it is easier to master than more abstract math. (Plus, our SmartGraphs software can help.)
Practical research ideas. One of the major problems students face is selecting a practical research question. InquirySpace will provide dozens of feasible and interesting research projects with suggestions and strategies for getting started.
Research community. Research is inherently a social act, performed and evaluated by peers. Students must engage an audience to understand this critical part of scientific research. We will provide an online community of student researchers and an online journal where student research reports can be saved or published.
Robert Tinker (bob@concord.org) is the founder of the Concord Consortium.
Ed Hazzard (ehazzard@concord.org) is a science curriculum developer.
This material is based upon work supported by the National Science Foundation under grant IIS-1147621. Any opinions, findings, and conclusions or recommendations expressed in this material are those of the author(s) and do not necessarily reflect the views of the National Science Foundation.
