Visual Process Analytics (VPA) is an online analytical processing (OLAP) program that we are developing for visualizing and analyzing student learning from complex, fine-grained process data collected by interactive learning software such as computer-aided design tools. We envision a future in which every classroom would be powered by informatics and infographics such as VPA to support day-to-day learning and teaching at a highly responsive level. In a future when every business person relies on visual analytics every day to stay in business, it would be a shame that teachers still have to read through tons of paper-based work from students to make instructional decisions. The research we are conducting with the support of the National Science Foundation is paving the road to a future that would provide the fair support for our educational systems that is somehow equivalent to business analytics and intelligence.
 This is the mission of VPA. Today we are announcing the launch of this cyberinfrastructure. We decided that its first version number should be 0.1. This is just a way to indicate that the research and development on this software system will continue as a very long-term effort and what we have done is a very small step towards a very ambitious goal.

VPA is written in plain JavaScript/HTML/CSS. It should run within most browsers — best on Chrome and Firefox — but it looks and works like a typical desktop app. This means that while you are in the middle of mining the data, you can save what we call “the perspective” as a file onto your disk (or in the cloud) so that you can keep track of what you have done. Later, you can load the perspective back into VPA. Each perspective opens the datasets that you have worked on, with your latest settings and results. So if you are half way through your data mining, your work can be saved for further analyses.
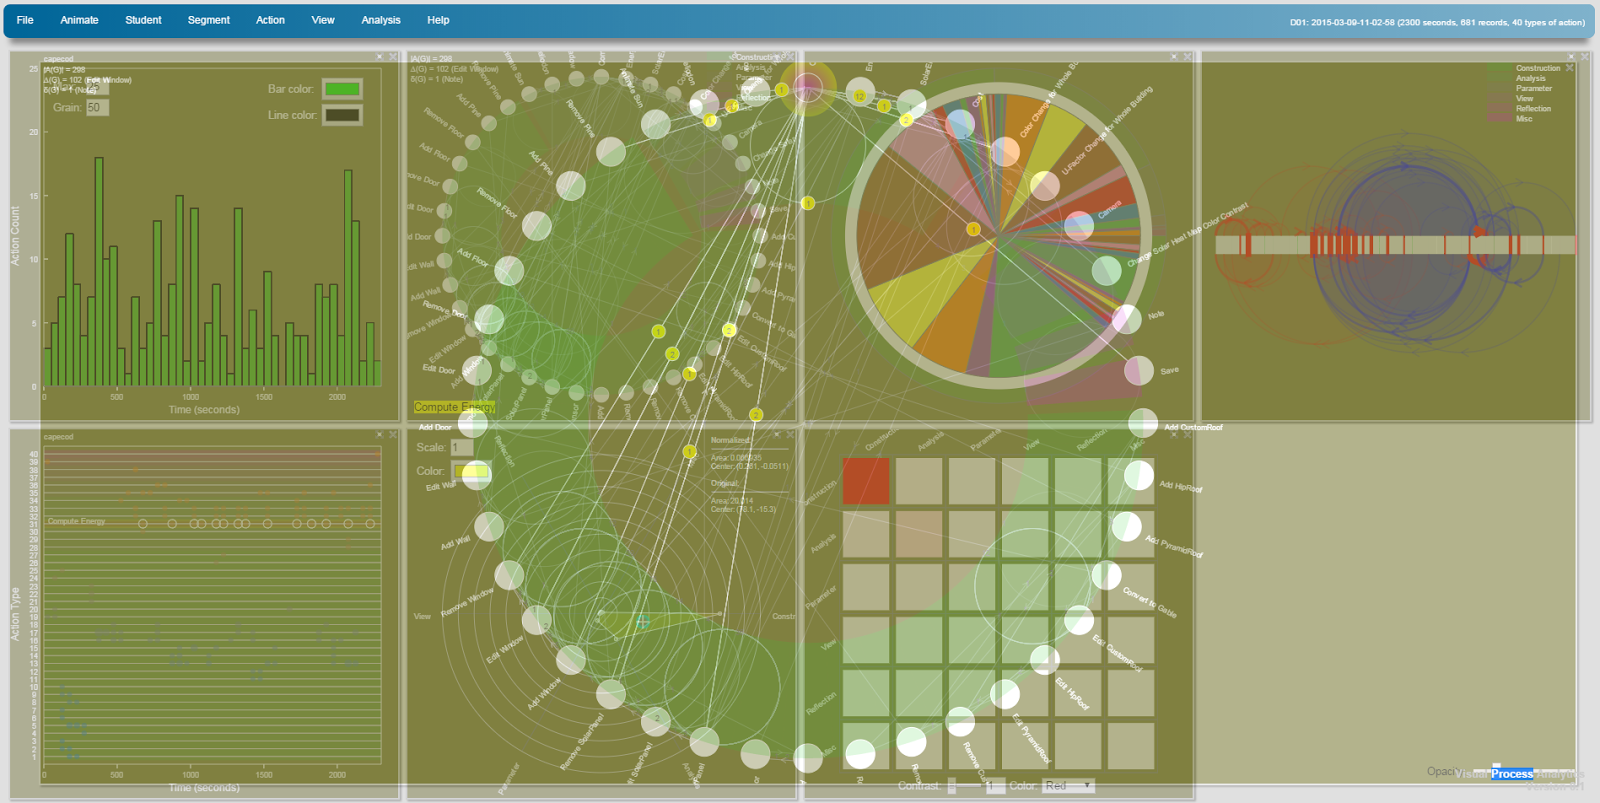
 So far Version 0.1 has seven analysis and visualization tools, each of which shows a unique aspect of the learning process with a unique type of interactive visualization. We admit that, compared with the daunting high dimension of complex learning, this is a tiny collection. But we will be adding more and more tools as we go. At this point, only one repository — our own Energy3D process data — is connected to VPA. But we expect to add more repositories in the future. Meanwhile, more computational tools will be added to support in-depth analyses of the data. This will require a tremendous effort in designing a smart user interface to support various computational tasks that researchers may be interested in defining.
Eventually, we hope that VPA will grow into a versatile platform of data analytics for cutting-edge educational research. As such, VPA represents a critically important step towards marrying learning science with data science and computational science.