Category: About Us

This week, a major snowstorm stretching from Texas to Maine is forecasted to affect millions of people. Many people throughout the U.S. now face the same questions. Do I have time to run to the store for more groceries before the heaviest snow is going to fall? Is school going to be delayed or canceled? […]
Do you have a teacher you are thankful for? I know I do. The one who comes to mind today is my 10th grade math teacher, Mr. Scheib. I had always enjoyed math and done well in it—until the third quarter of sophomore year. My mother took a second shift to help make ends meet. […]
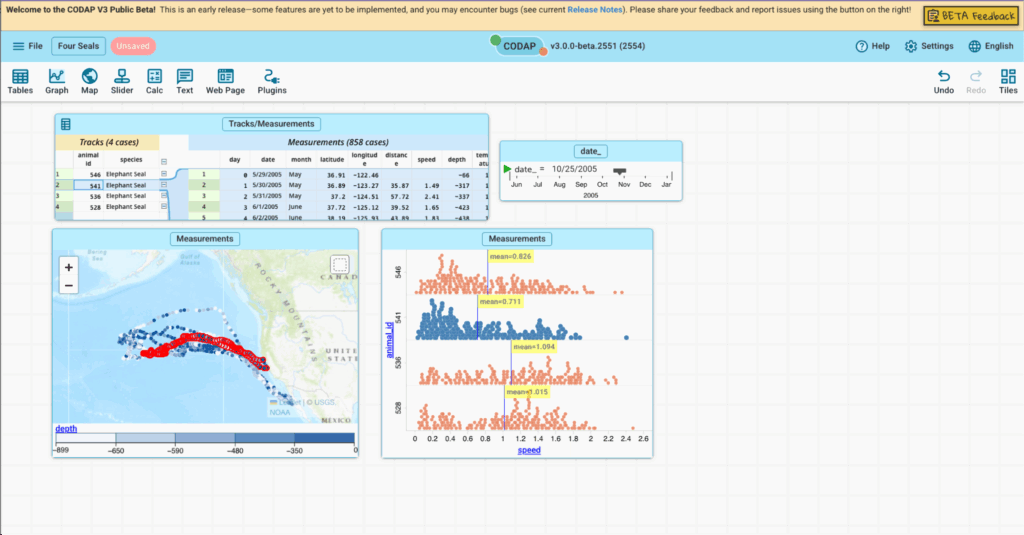
Our Common Online Data Analysis Platform (CODAP)—used by over 3.5 million users worldwide—is one of the most popular tools for data exploration. And now it’s better than ever! The beta release of CODAP V3 is officially live and ready for you to try. At the Concord Consortium, we like to dream big. One of our […]

The Concord Consortium is proud to announce a new grant from the National Science Foundation, titled Separating the Signal from the Noise (or SeismicML for short). This three-year project with Kent State University, the University of Washington, and the Anchorage School District will design, develop, and test computational tools that enable middle and high school […]

We are thrilled to announce that the Concord Consortium has been awarded a new grant from the National Science Foundation to design and test innovative ways for the public to engage with storm forecasting information through simulation-based experiences. The three-year Advancing Public Literacy of Uncertainty in Science (APLUS) project aims to help adults understand Atlantic […]
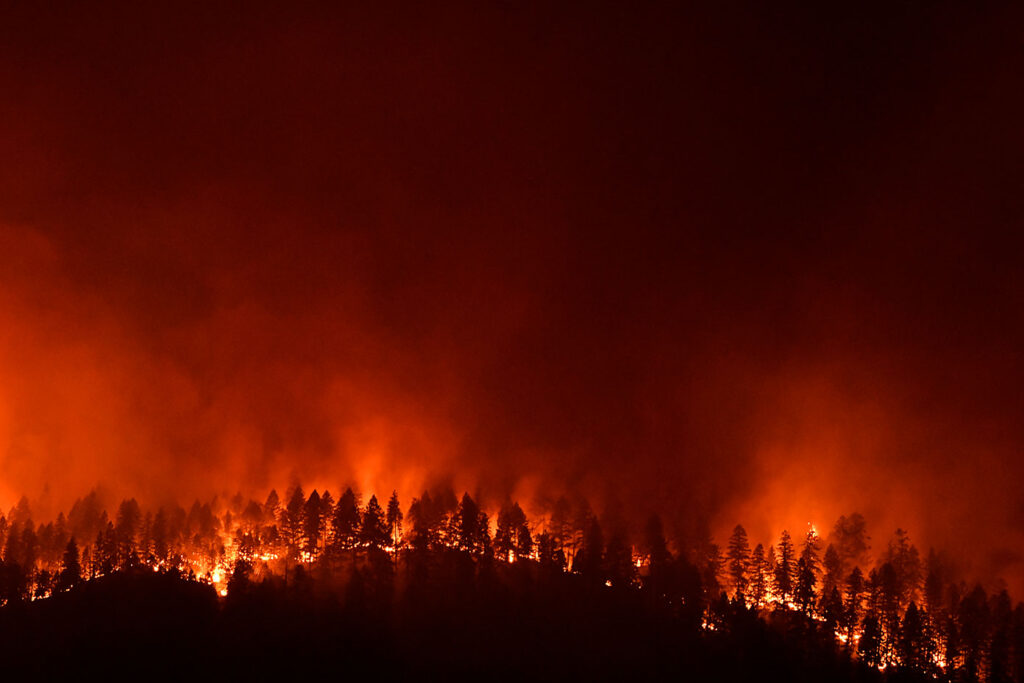
The Concord Consortium is proud to announce a new grant from the National Science Foundation for our Intelligent Simulation-based Learning About Natural Disasters (ISLAND) project. ISLAND will harness the power of artificial intelligence to help middle school students explore wildfires, floods, and hurricanes through scientific simulations—building critical knowledge and science practices for understanding and responding […]

There has never been a more urgent—and more promising—moment for STEM education. As we face critical global challenges, from climate change to the rapid evolution of artificial intelligence, the need for a scientifically literate society and a skilled STEM workforce has never been greater. Advances in technology offer powerful new opportunities to reimagine how we […]

With a free account on our STEM Resource Finder, teachers can create classes, assign activities, track progress in real time, and provide their students with timely feedback. We are excited to announce new features in our class management system and dashboard, inspired by teacher requests. Best of all, they’re ready just in time for the […]
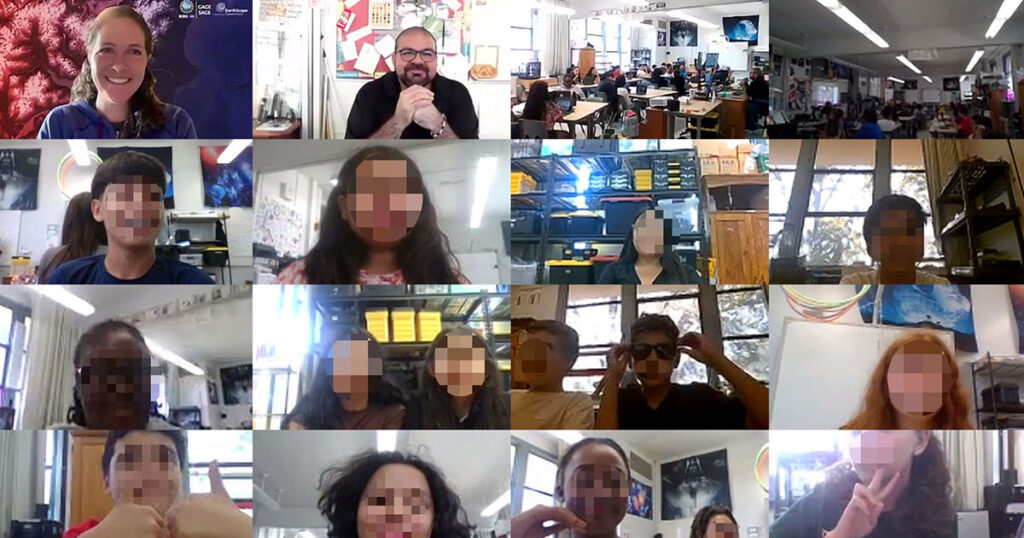
Shelley Olds is an instructional designer at EarthScope Consortium and a partner on the YouthQuake project. Generating thoughtful questions—and building the confidence to ask them—is a cornerstone of scientific inquiry. Middle school students in the YouthQuake project had the rare opportunity to ask geoscience professionals about their journeys into STEM careers and explore their own […]
The Concord Consortium is a 501(c)(3) nonprofit charity registered in the U.S. under EIN 04-3254131. Our financial statements are a record of our achievements. New this year, we’re offering our 2024 annual report as a downloadable file. 2024 Annual Report Download the 2024 annual report Audited financial statements FY 2024 Audited Financial Statements FY 2023 […]