Category: Tag: seismic
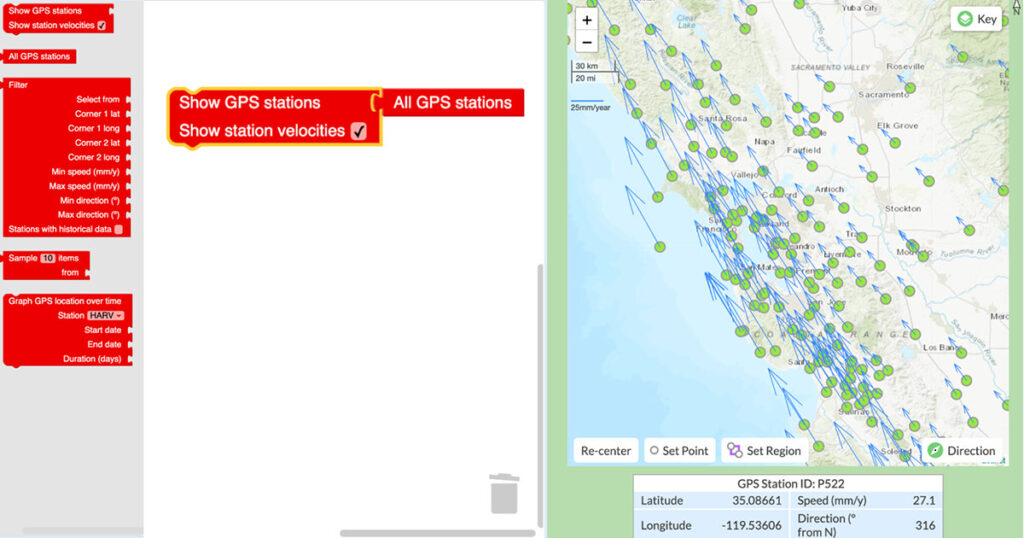
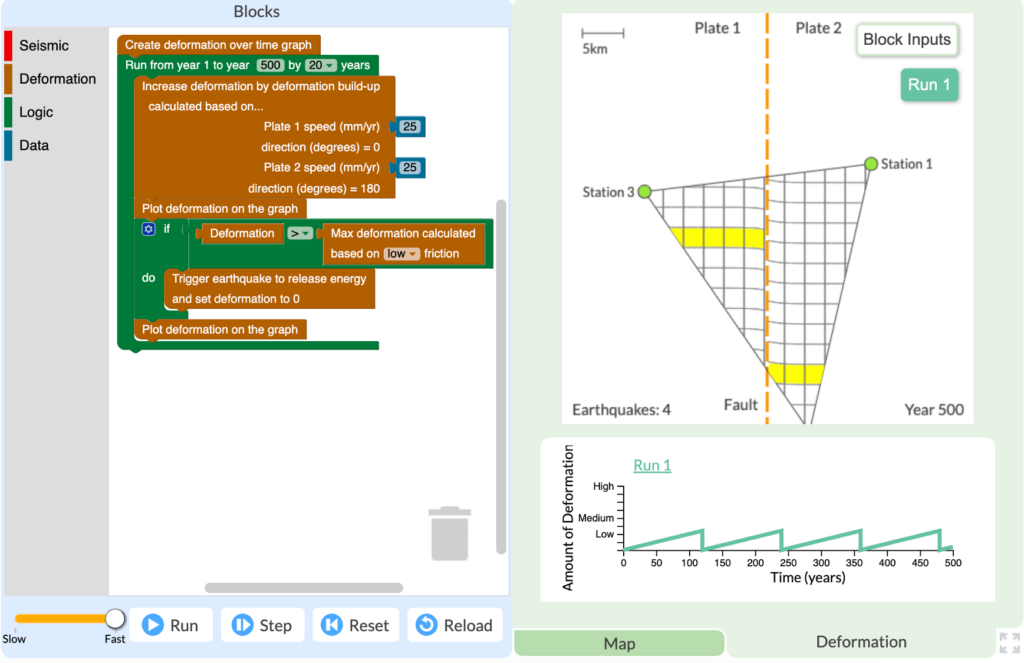
Shelley Olds is an Instructional Designer at the EarthScope Consortium. Many middle and high school students learn about earthquakes by studying California since it is the most seismically active state in the contiguous United States. Students learn that there is an earthquake cycle and that the cycle that ends with an earthquake. But what happens […]
Symbols, objects, maps, graphs, and simulations are all powerful tools for conveying information. However, some complex ideas just can’t be captured in a single representation. In these cases, multiple visualizations can be used together to convey and connect several pieces of related information. For example, during the COVID-19 pandemic, news organizations used a combination of […]