Blog

Making data exploration accessible for blind and low-vision learners using AI

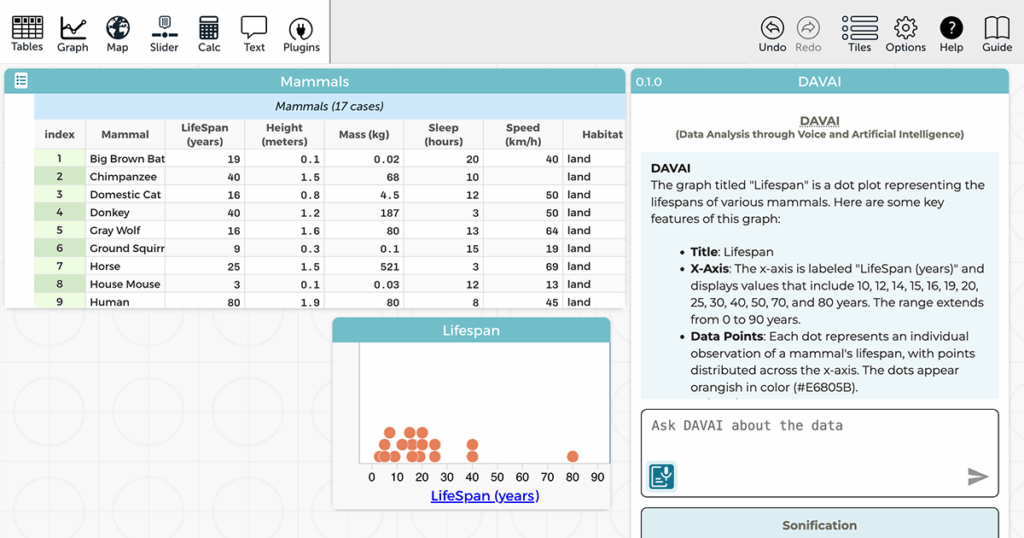
A screenshot of CODAP showing a data table of mammals and their characteristics, a dot plot of the lifespan of the mammals in the table, and a window that contains the DAVAI plugin, displaying some of the descriptive text DAVAI generated when the user asked for a description of the lifespan dot plot. The text displayed in the DAVAI plugin is: DAVAI. The “LifeSpan Dot Plot” presents a visual representation of lifespan data for various mammals. Here’s a detailed description of the graph: Title: The graph is titled “LifeSpan Dot Plot” and is displayed at the top. X-Axis: The horizontal axis represents Lifespan in years, ranging from 0 to 90 years. The x-axis is labeled “LifeSpan (years)” in blue. Dots: Each dot represents a data point for the lifespan of a mammal. Color and Size of Dots: The dots are orange in color and vary slightly in size, giving the plot a ...The text is cut off at this point, but in the image it is in a scrollable window, so the assumption is the user could scroll to see the rest.

Our Common Online Data Analysis Platform (CODAP) engages learners in data science practices, including data analysis and visualization. But what does “visualization” mean to blind or low-vision (BLV) learners? A new National Science Foundation-funded project is using artificial intelligence (AI) to develop and research new tools for making data exploration accessible to BLV learners. Graphs—and […]
Continue reading