At the Concord Consortium, we believe that science education should reflect the dynamic, uncertain, and inquiry-driven nature of science itself. In our recently published study in the International Journal of Science Education, we explore how middle and high school students engage in hurricane science by interacting with the very tools scientists use to reason about natural hazards: scientific inscriptions. Results show that students can use uncertainty as a productive lens.
- Secondary school students are capable of reasoning with scientific uncertainty—an essential skill in today’s world. Through engagement with simulations, graphs, and maps, students begin to understand not only what scientists know about hurricanes, but how they know it, and why predictions are made despite incomplete and evolving information. This encourages students to critically reflect on what is known and what is uncertain.
- By embedding uncertainty as a feature—not a flaw—of science education, we help students move beyond simplistic notions of science as fixed facts. Instead, they learn to interpret evidence, assess confidence levels, consider limitations, and make informed judgments. These are skills they can carry into their roles as future decision-makers, citizens, and science-literate adults.
Scientific inscriptions
In science, inscriptions are the symbolic tools used to communicate meaning and include graphs, equations, tables, and more. Scientific visualizations are also considered inscriptions as they represent the creator’s knowledge about the phenomena under investigation.
To communicate scientific knowledge, trends in data, and forecasting what might happen, hurricane scientists use various visual inscriptions: simulations of a hurricane, graphs of rising sea surface temperatures, and forecast maps with cones of uncertainty.
Our study asked: what happens when students use these inscriptions? Can they reason meaningfully about hurricanes and risk the way scientists intended—especially considering that scientific uncertainty is not something they usually learn in science class?
We designed and implemented a curriculum module focused on developing students’ hurricane literacy, through engagement with three types of inscriptions: maps, graphs, and a simulation. Our goal was to help students not only understand how hurricanes behave, but also how uncertainty shapes scientific reasoning and real-world decision-making.
Hurricane literacy
As climate change contributes to fuel stronger and more frequent tropical storms around the world, the need for hurricane literacy has never been more urgent. Hurricane literacy includes understanding the mechanisms behind storm development, the likelihood of hazardous events occurring, the impacts storms can cause, and the strategies communities can take to reduce those impacts.
Importantly, hurricane literacy also involves the ability to interpret scientific information communicated through public forecasting tools—many of which embed uncertainty. Knowing what the cone of uncertainty represents, how historical trends can signal future risks, or why hurricane forecasts can shift over time are all part of this scientific and civic literacy.
Three types of scientific inscriptions in the hurricane module
To engage students in developing this literacy, we designed investigations using different types of inscriptions.
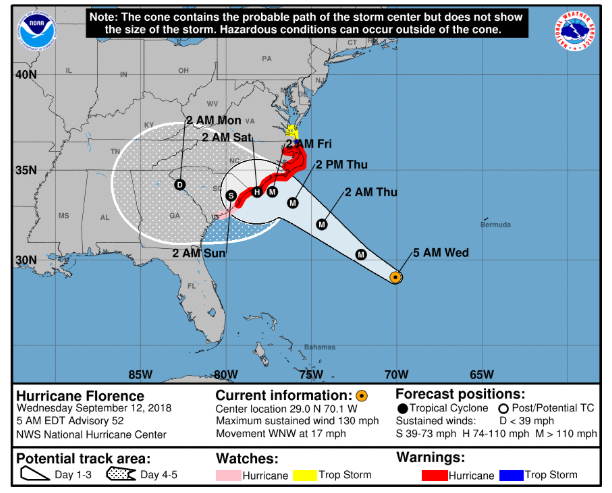
- Maps. In the risk investigation in the first activity of the module, students interpret cone of uncertainty graphics, widely used tools in hurricane forecasting. They use these graphics to analyze which areas might be affected by an approaching storm, assess risk to communities, and reflect on the limits of forecast certainty.
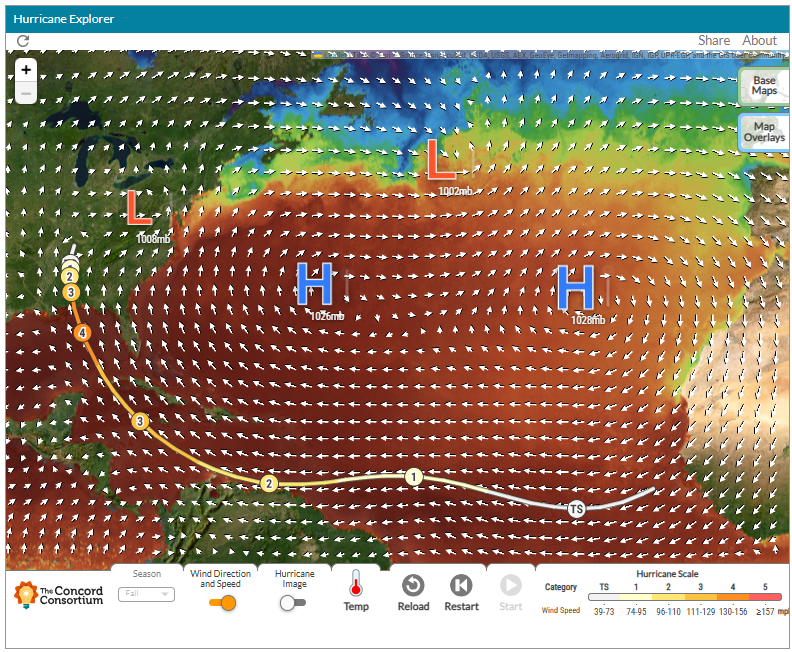
- Simulations. In the path investigation at the end of the second activity, students use the Hurricane Explorer, a dynamic, interactive simulation of hurricane progression over the Atlantic Ocean. The simulation allows users to manipulate sea surface temperature, wind direction, and pressure systems to model how a storm moves and changes intensity. Students use this to investigate how storm tracks are influenced by environmental conditions and why predictions are difficult.

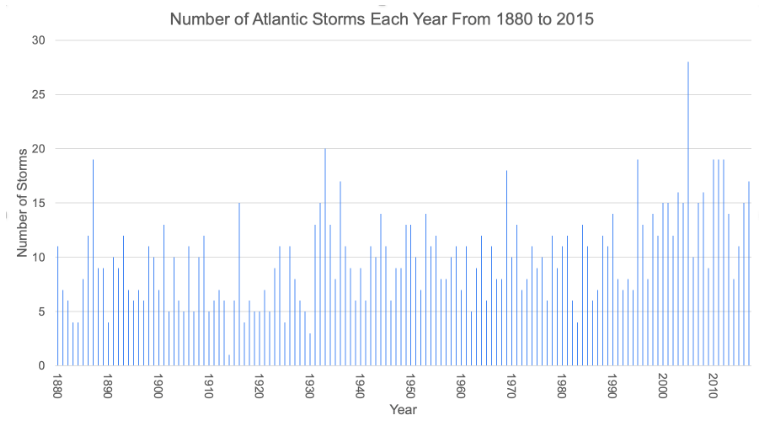
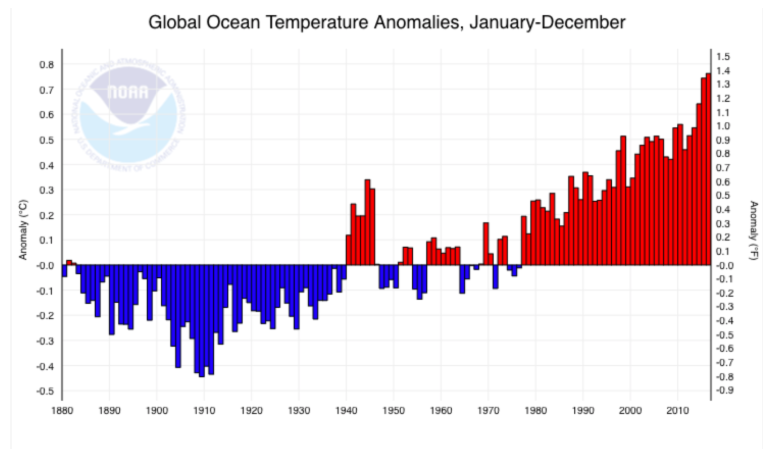
- Graphs. In the trend investigation at the end of the third activity, students interpret historical sea surface temperature and storm frequency data to identify climate-related trends. They explore how warming oceans have influenced the number of high-category storms over time, and consider how these trends might inform future forecasts.


Each type of inscription offered a distinct form of engagement, prompting students to reason in different ways depending on the nature of the visual representation. Some inscriptions, such as graphs and maps, were static and required interpretation of existing data, while the Hurricane Explorer simulation was interactive and allowed for variable manipulation and real-time exploration.
Across these experiences, students were invited to grapple with uncertainty. The cone of uncertainty graphic represents probabilistic forecasts of where the hurricane’s eye may travel; the Hurricane Explorer simplifies reality and does not include all environmental conditions that affect storm behavior; and the historical data reveal year-to-year fluctuations, making trend interpretation more complex.
Students’ reasoning about uncertainty
In each investigation, students were asked to make a scientific claim in response to a guiding question, rate their certainty about that claim, and explain their reasoning. We analyzed students’ written explanations to identify the types of uncertainty they were able to articulate, revealing how they engaged with inscriptions and interpreted them as sources of evidence. From this analysis, we identified five distinct types of uncertainty reflected in students’ reasoning:
- Conceptual Uncertainty – Students expressed uncertainty about their understanding of scientific concepts, such as how sea surface temperature influences storm formation and intensification.
- Material Uncertainty – Students’ reasoning often reflected awareness of what aspects of a hurricane system were and were not represented in each of the three types of inscriptions (or materials) they used, what kind of information the inscription provided, and whether it was designed for interaction or communication.
- Epistemological Uncertainty – Students reflected on the appropriateness of generating evidence from different inscriptions, in other words, how they contemplated the nature of knowledge generation, or their epistemology. Students considered whether the inscriptions aligned with established scientific norms and practices for collecting, analyzing, and interpreting data in hurricane science, and whether their claims were supported by valid and reliable evidence.
- Social Uncertainty – Students considered contextual and societal factors in their reasoning, including how hurricane forecasts might impact different communities, how to account for social vulnerabilities, and the presence of scientific consensus or disagreement—both among experts and within their peer groups.
- Psychological Uncertainty – Some students referenced their own confidence, citing their level of general knowledge, familiarity with the content or tools, or prior personal experience with hurricanes. These self-assessments influenced how certain or uncertain they felt about their claims.
By identifying these uncertainty sources, we were able to understand how students reasoned about both the sufficiency and limitations of inscriptions as evidence when making claims. Rather than viewing uncertainty as a barrier, students can use uncertainty as a productive lens through which to evaluate evidence, justify their decisions, and connect scientific ideas to real-world contexts.
Interested in more?
We’ve also developed open-source simulations and free curriculum modules for wildfires, including boreal forest fires, earthquakes, floods, and volcanoes. All of these are designed with the same focus on scientific uncertainty in science practice, student engagement, and real-world relevance.
If you’re an educator, researcher, or curriculum designer interested in using or adapting these tools—or in collaborating around hazard education—we’d love to connect.