We’re making data science accessible and empowering students to understand and analyze complex data without hours of coding lessons or years of advanced mathematics. A new collection of Dynamic Data Science activities designed for students in grades 9-14 is now available to get students working with data!
 |
National Health and Nutrition Examination Survey Data Portal Students select and investigate subsets of the dataset from the National Health and Nutrition Examination Survey, to find the cholesterol level of U.S. citizens, for example, or try their own data science challenges. |
 |
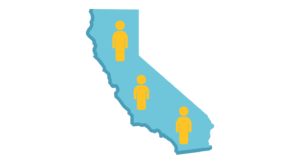
California American Community Survey Data Portal Using demographic data from the U.S. Census Bureau’s American Community Survey, students can find the average income of Californians of different age groups in 2013, then investigate their own questions. |
 |
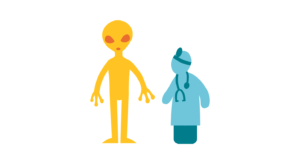
Trees in a Diagnosis Game Students use data to build binary trees for decision-making and prediction. They put “training data” through an algorithm, then automate the process to test their ability to predict which alien creatures are sick and which are healthy. |
 |
Stella Students act as astronomers, studying stars in a “patch” of sky in our own galaxy. Using simulated data from spectroscopy and other real-world instrumentation, students learn to determine star positions, radial velocity, proper motion, and degree of parallax. |
 |
BARTy Modeling traffic data is important for urban planning, creating transportation systems, and predicting foot traffic in retail stores. Students investigate Bay Area Rapid Transit (BART) data from 2015 to learn about passenger use and explore traffic patterns. |
 |
Geiger Students try to track down a speck of extremely dangerous radioactive material (the “source”), which has been lost somewhere in the middle of their lab. Using mathematical models, students generate strategies for winning the game with data. |
 |
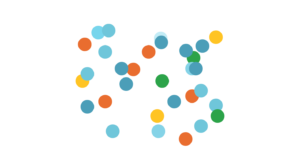
Stebbins Stebbins is a game about evolution. Students collect data as predators “eating” colored circles on a colored background, being careful to avoid the poisonous ones. Data analysis reveals how the population changes color over time. |
Each activity includes an embedded simulation that generates or accesses Big Data (well, reasonably big!) for students to work with CODAP (Common Online Data Analysis Platform). The resulting, often quite large, datasets have many variables and are a bit unwieldy and mysterious—and contain hidden patterns for seekers to discover. CODAP’s tools for analysis and visualization make the activities accessible to novice and seasoned explorers. Our aim is to bring large datasets to the classroom in varying contexts, from rapid transit systems to demographics to stellar investigations, enabling teachers across the curriculum to introduce students to data science.
From combating global warming to feeding the growing population, reducing violence, and increasing equity, data science will be at the heart of future solutions to many significant problems in society. Our goal is to inspire students to become fluent with data in order to address the world’s complex problems with data-driven solutions.