

Under the Hood: New CODAP Plugin Displays Hierarchical Data
Our web-based Common Online Data Analysis Platform (CODAP) is a robust environment where students use a simple drag-and-drop interface to organize, transform, and create visualizations of data. CODAP is also a powerful dual development environment. First, developers can build on top of CODAP, as we did with our system modeling tool SageModeler. Second, developers can build plugins within CODAP using an API that allows the plugin to both talk to CODAP and to monitor what the user is doing in CODAP, so it can respond appropriately.
Our Supporting Reasoning with Multi-dimensional Datasets project, funded by the National Science Foundation, is exploring new ways of working with complex data using CODAP’s plugin capabilities. The goals are to study how students conceptualize and work with multidimensional data and to develop ways to assist in sense- making with this kind of data.
Data are often formatted in a two-dimensional “flat” display of rows and columns. However, grouping can help reveal patterns. For instance, you might want to look at data about households within counties within states. Or you might be interested in data about animals that live in different habitats, and decide to group them by land, water, or both.
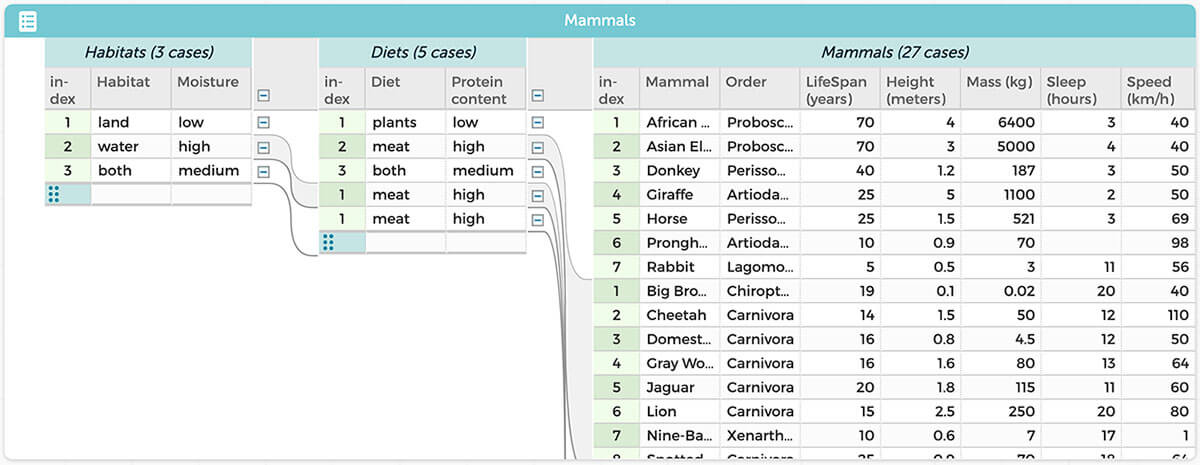
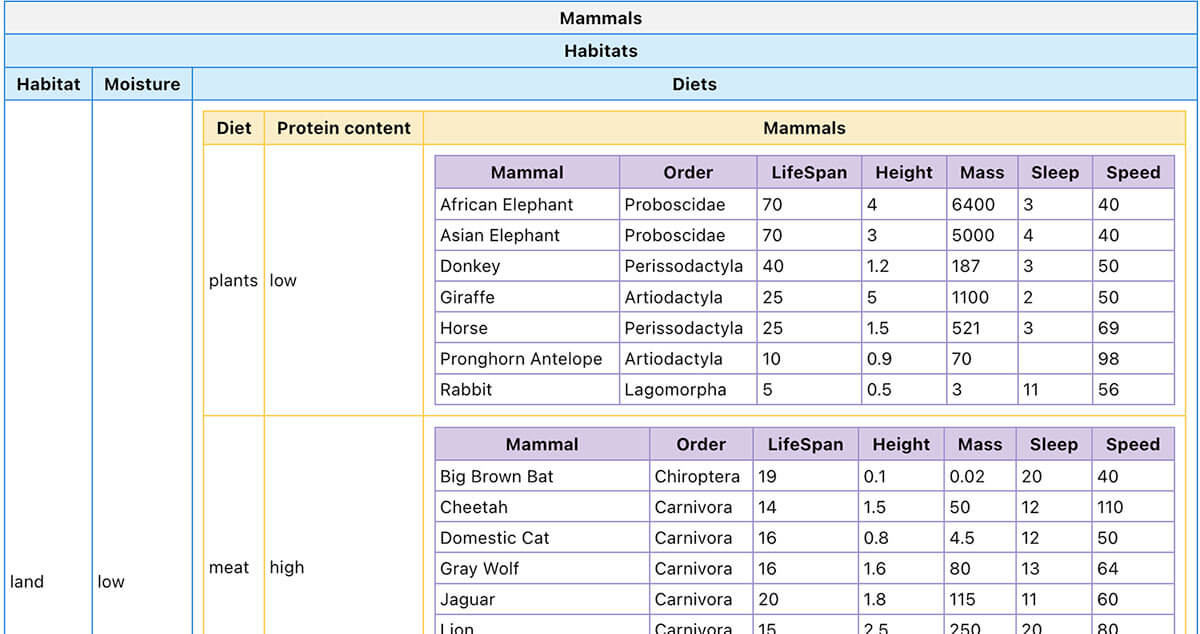
In CODAP, users can visualize such hierarchical data in a standard CODAP table representation (Figure 1). While this representation is compact, research shows that the hierarchical relationships between cases are not clear to every user. We hope to provide additional representations to make analyzing such data easier. For instance, Figure 2 shows one way our new MultiData plugin represents the same data using colors and a “box within a box” type structure.
Furthermore, the plugin allows the user to switch between different representations of the hierarchical data. And since it’s a plug-in, the user can compare—simultaneously on screen—the MultiData representation to the standard CODAP table.
The CODAP Plugin API is built on top of the window.postMessage( ) API, which allows for cross-origin communication between a webpage and a pop-up or iFrame. The MultiData plugin makes use of the CODAP Plugin API to get information about the CODAP table data, then subscribes to notifications from CODAP so that anytime the data changes, the plugin can update itself accordingly.
The Plugin API also supports adding listeners to the CODAP table, which can be used to allow the CODAP table to monitor changes in the plugin. Consequently, changes made by interacting with the plugin are simultaneously reflected in the CODAP table structure.
The next phase of work on the Multi-Data plugin will involve utilizing this aspect of the API so that the plugin is not just an alternate representation of the hierarchically structured data, but also becomes a user interface for organizing data into different structures.
The CODAP Plugin API is well documented, and we encourage developers to build their own CODAP plugins. See some of what’s possible by clicking the Plugins button in the CODAP toolbar.
Dan Damelin (ddamelin@concord.org) is a senior scientist.
Lucy Blagg (lblagg@concord.org) is a software engineer.
This material is based upon work supported by the National Science Foundation under grant DRL-2201177. Any opinions, findings, and conclusions or recommendations expressed in this material are those of the author(s) and do not necessarily reflect the views of the National Science Foundation.