Data Detectives Clubs Combine Narrative, Data, and Sound
Stories help us understand the events and phenomena around us. When a new respiratory disease disrupted our lives in early 2020, children wanted to know where it came from, how it spread, how many people were affected, and how to get through it. Tumblehome, Inc. told the story of the pandemic through a middle school adventure novel, The Case of the COVID Crisis. The book is now the centerpiece of a project funded by the National Science Foundation designed to empower young people to understand data science through epidemiology.
The COVID-Inspired Data Science Education through Epidemiology project has developed ten sessions for youth as part of “Data Detectives Clubs.” Middle school students read The Case of the COVID Crisis and engage in related data activities using CODAP and NetLogo.
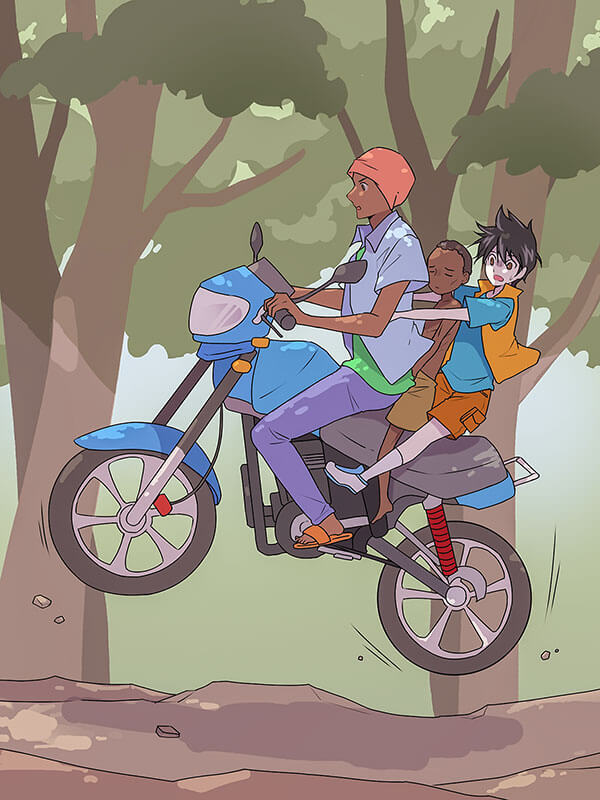
The adventure story follows two middle school students, Clinton and Mae, as they travel through time on a mission to learn about pandemics of the past and present (Figure 1). Young readers learn from the adventures of these time travelers that others have also suffered through disease outbreaks, often without the tools—testing, vaccines, medications—that science offers today. The Case of the COVID Crisis presents an accurate portrait of efforts to conquer smallpox, the 1918 flu, measles, Nipah, Ebola, and COVID. Equal parts discovery, danger, math, and science, the story portrays diverse scientists in places as far apart as the U.S., Bangladesh, Brazil, and the Congo.
The roles of narrative and data
Narrative, especially historical narrative, can engage and motivate students while teaching how science is done. Stories—with their twists and turns, climax, and denouement—can mirror the nature of science, with all its uncertainties, errors, and disputes. Narrative can also inspire. Placing readers in cultural and historical settings where scientific problems arise allows youth to imagine themselves as heroes responding to the challenges of their time with science. Finally, stories allow readers to identify with diverse, often young, characters who overcome their own hesitations to become passionate learners and defenders of science.
But the story of COVID-19 is best told through more than words. Data tell their own story, and there has never been a pandemic more steeped in data. COVID data are fine-grained and available in near real time from the Centers for Disease Control (CDC), the World Health Organization (WHO), and others. To create curated datasets and data exploration activities for Data Detectives Clubs, Tumblehome partnered with the Concord Consortium.
Together, we built a plugin for the Common Online Data Analysis Platform (CODAP) that connects to current data from the CDC. Students can download datasets with both categorical and numerical data about COVID, including number of cases and vaccinations by state and county. They can transform data tables into graphs by dragging and dropping variables onto the horizontal and vertical axes. Students can make additional data moves by creating nested, hierarchical data, such as by country, state, and city.
In one activity, middle school youth compare time-series data on the number of people infected or vaccinated by country, say, Italy or Brazil, or state, for example, California and Louisiana. They can compare the pandemic over time, including its magnitude and infection rate in different countries while linking daily incidence of infection to cumulative numbers of infected people.
In another activity, students use CODAP’s mapping tool to explore how smallpox waxed and waned in waves across continents until it finally disappeared through a worldwide vaccination campaign. The quantitative data is represented as colors on the map that change over time.
NetLogo simulation
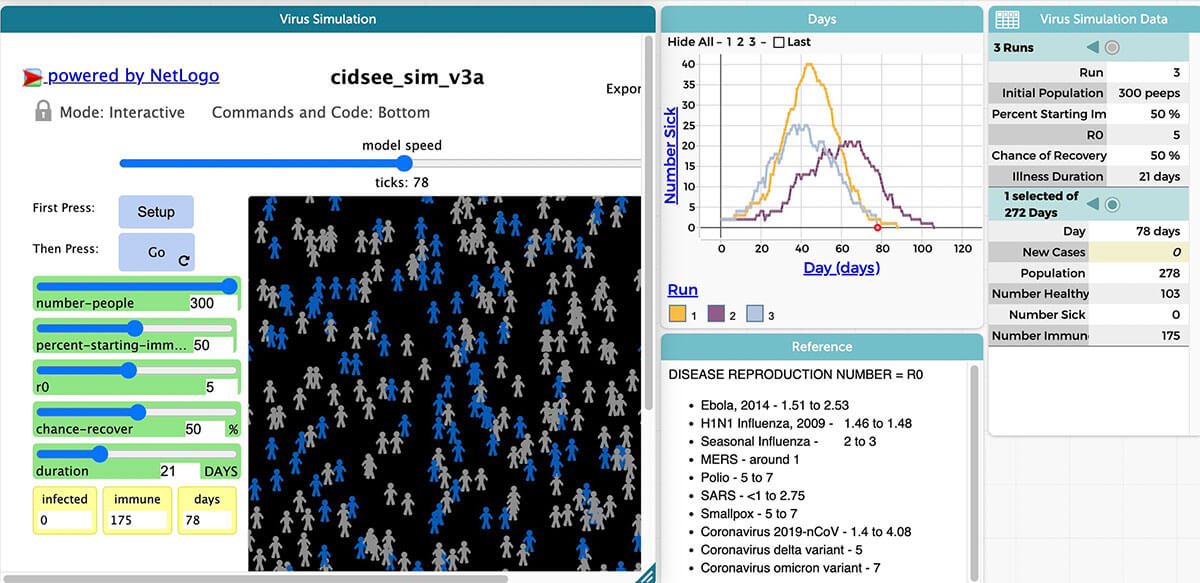
We also developed a simulation of the spread of a virus using the free, agent-based modeling program NetLogo, which we integrated into CODAP as a plugin (Figure 2). The simulation begins with 300 icons of people (called “peeps”), two of them colored red to show that they are infected. As the peeps move and randomly bump into one another, they change color to show themselves becoming infected or immune. Simultaneously, CODAP creates a corresponding time-series graph showing how the number of currently infected peeps rises and falls.

Students explore the simulation and data visualization to understand how the course of an outbreak is affected by the number of non-immune people that each infected person is likely to infect (R0, or R-naught). Changing the starting R0 to be similar to SARS-1, COVID, Ebola, or measles changes the peak and duration of the infection curve. Running a simulation several times with the same starting parameters allows students to observe how random variation makes precise prediction difficult.
In a culminating activity, youth explore the concept of herd immunity by varying only the percentage of peeps who start off immune (or vaccinated). They discover that for a disease with the infectivity of COVID-19, there is a threshold once approximately 75% of the population has been vaccinated. At that level, further vaccination provides little additional benefit, even in a hypothetical disease with an unlikely death rate of 50%.
The sound of data
Sound can tell a story, too. Think of the sound of footsteps or a fire engine approaching and receding. We recently piloted the idea of sonifying data, providing students with kazoos and challenging them to “play” a graph, changing pitch as the graph rises and falls. When they looked at data of infected people, students played a high pitch when more people were getting sick and a low pitch during a time of relative disease quiescence.
We plan to build a new sonification feature for CODAP, which will create a continuous “line” of sound, varying in pitch or volume, that echoes movement in the value of a variable over time. In a more complex graph, comparing two different lines, students could hear two instruments, each playing its own line. And for the NetLogo simulation of infection spread, a beep or tick could sound each time a new person is infected, alerting users to changes in the infection’s rate of spread.
Conclusion
To date, over 750 youth in grades 4–8 in communities around the U.S. have participated in Data Detectives Clubs. They have shown consistent growth in measures of STEM engagement, STEM identity, STEM career interest, and data scientist identity. Future research will examine what variations in sound can add to young people’s understanding of change over time.
We are thrilled that an adventure story about science—combined with interactive data activities that use real-world data—makes young readers want to learn more about the science. Narratives should not stand alone. Scientists collect and interpret data on their adventures. Students should, too.
Penny Noyce (pendrednoyce@gmail.com) is a founder of Tumblehome, Inc.
Jan Mokros (jan@tumblehomelearning.com) is a lead researcher at Tumblehome, Inc.
Bill Finzer (wfinzer@concord.org) is a senior scientist and lead developer of CODAP.
This material is based upon work supported by the National Science Foundation under grant DRL-2048463. Any opinions, findings, and conclusions or recommendations expressed in this material are those of the author(s) and do not necessarily reflect the views of the National Science Foundation.