
How Do Teachers in Networks Use Digital Resources?
The Concord Consortium and Michigan State University are developing the Collaborative Learning User Environment (CLUE), a multi-featured digital platform designed to support groups of students working together to solve mathematical problems. Teachers have access to an embedded teacher guide and an additional suite of features for planning, teaching, and reflecting on their instructional practice. In a new project designed to facilitate collaboration among teachers in the same building or district, we’re adding teacher networking supports and features so they can share their successes and struggles, engage in ongoing professional learning, and participate in collaborative teacher inquiry.
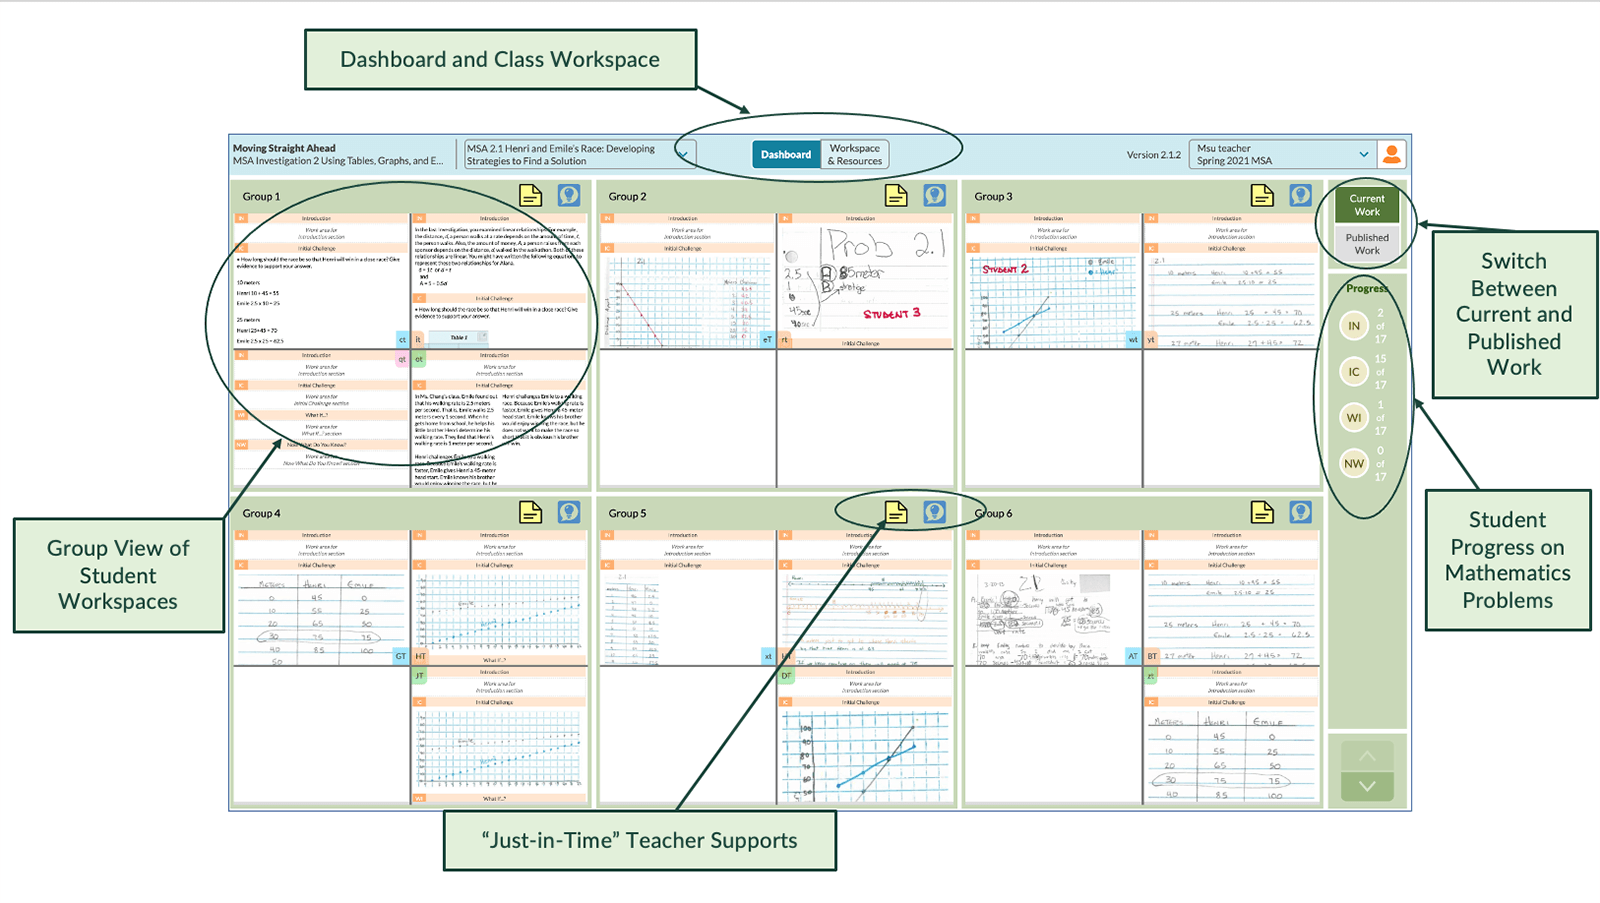
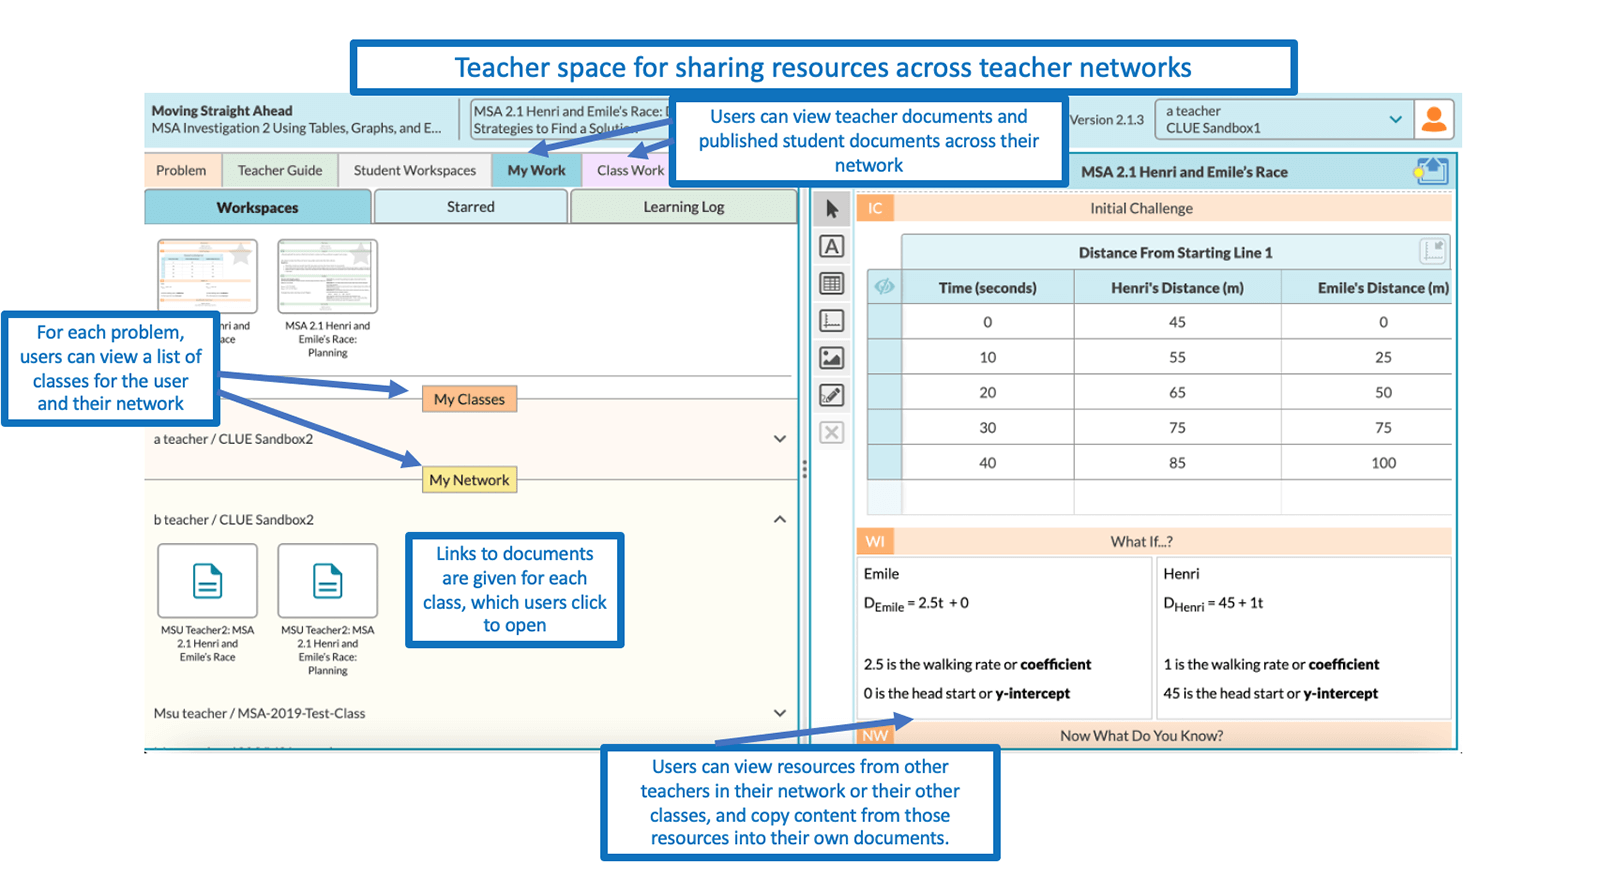
We have embedded three seventh grade units and teacher guides from the Connected Mathematics Project (CMP) curriculum into CLUE. Students use the software tools to create graphs, text, images, and drawings and to share or co-develop their mathematical thinking with their small group and larger classroom community. Teachers can view students’ individual and group work through a dashboard that monitors student thinking across a class (Figure 1). New network features allow teachers to see student work or work created by teaching colleagues (Figure 2) and discuss it using threaded discussions that are linked to the shared documents.
The CLUE platform provides a unique opportunity to study how teachers prepare for teaching, implement the CMP curriculum in their classroom, and reflect on student learning. We are studying how teachers access, generate, share, and use digital resources to assess its usability, flexibility, and effectiveness in bringing this problem-based learning curriculum to life in the classroom. We are also interested in understanding how teachers interpret the embedded resources. This study focuses on how teachers in small networks interact with CLUE teacher resources and their collaboration and communication using the digital platform.
Framing the study
Digital tools provide new opportunities for detailed study of teachers’ use of online resources. As teachers use the platform, we’re able to capture a trail of “events” that provides insights into what resources they visit and their interaction with them. While these log files are an important source of data for this study, they show only what was done, but not necessarily the teachers’ motivation or the conclusions they drew. Additional data come from an electronic survey that asked teachers about their planning, teaching, and reflection practices prior to implementing CLUE. Finally, we conducted semi-structured, follow-up interviews about teachers’ experiences for each CMP unit.
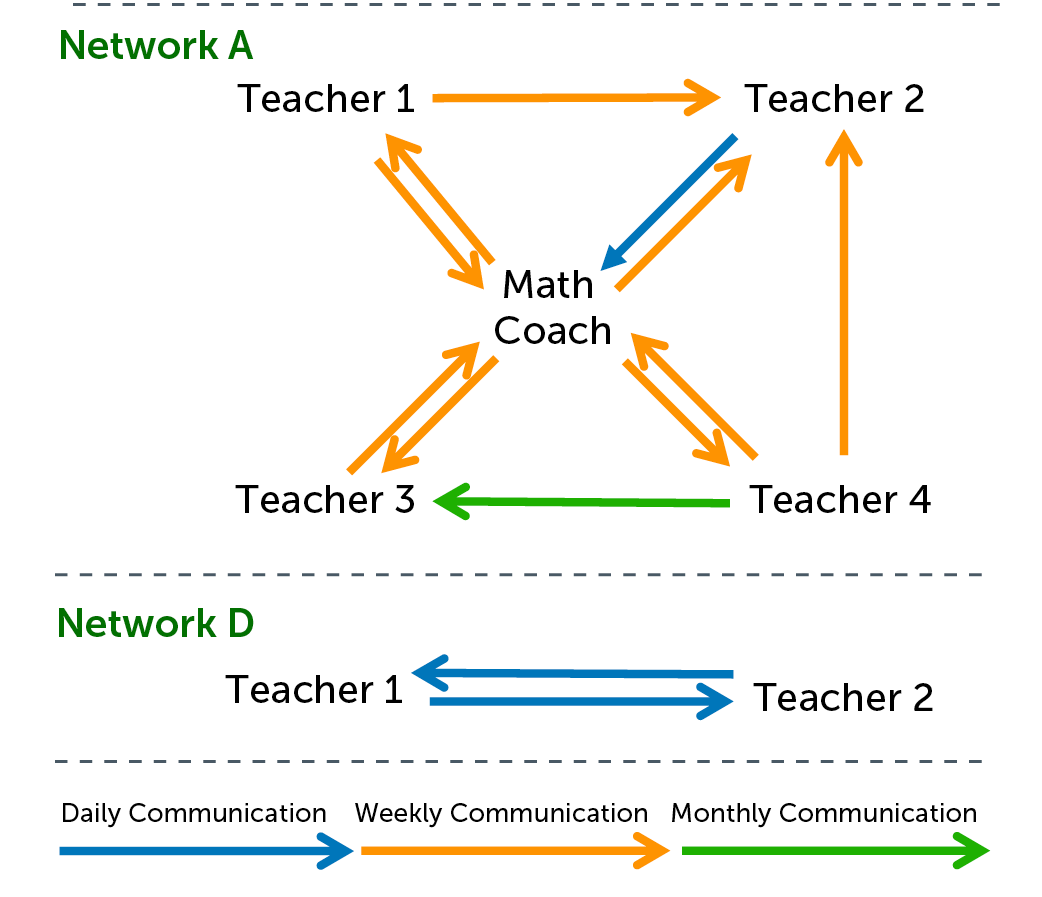
Here we look at the work of two of the five networks of seventh grade teachers from the 2021-22 school year. We selected these networks because they illustrate contrasting approaches to using, sharing, and co-developing digital teaching resources. Network A consists of four teachers and one mathematics coach and Network D consists of two teachers and no coaches. The communication frequencies differed between networks (Figure 3). Network A shared synchronous planning time every other week, while for Network D, such synchronous planning time occurred daily. Teachers in both networks engaged students in using CLUE for multiple problems across three CMP units.

We reviewed data log files that record every teacher (and student) action in CLUE. Log files include a detailed record of when and how teachers viewed or acted on various tools and documents, such as accessing problems in the student edition or a problem solution from the teacher guide or adding or responding to a comment on a colleague’s document. We looked across all log events to identify similarities and differences in the ways teacher networks used CLUE. Our analysis focused on how teachers use digital resources as they examine existing materials through “viewing” events or develop or edit materials through “action” events. Survey responses and interviews helped us learn more about teachers’ practices when not using the digital platform and allowed us to make additional comparisons of the two networks.
| Unit | Network A | Network D |
|---|---|---|
| Stretching and Shrinking | 6 problems 558 events | 9 problems4275 events |
| Comparing and Scaling | 6 problems 455 events | 3 problems528 events |
| Moving Straight Ahead | 4 problems 572 events | 5 problems2980 events |
| Total | 16 problems 1585 events | 17 problems7783 events |
Results
Analysis of the digital events showed varying degrees of resource use for both networks (Table 1). Teachers in both networks engaged with a similar variety of variety of problems and units in CLUE, although Network D engaged with the platform to a greater extent, including teaching multiple classes of students and viewing digital resources during daily shared planning time. Network A’s platform usage varied greatly by unit and by user (teachers and coach), while Network D’s usage was more consistent between the two teachers.
Digital Materials as Resources
Both networks used a variety of digital materials as resources for planning, teaching, and reflecting on mathematics problems (Table 2). Interactions with teaching documents (e.g., generating graphs and tables, creating documents for students) are the most common, accounting for approximately 41% of Network A events and 77% of Network D events. Both networks also frequently accessed student edition resources. However, the networks showed different overall patterns of resource use. Although Network A accessed resources with less frequency, they accessed resources in different categories with similar consistency. Network D accessed the platform frequently, but their access focused primarily on resources for students. We found a statistically significant difference between networks for frequency of access and use across nine resource categories (Table 2). The only exception was the embedded problem solutions, which both networks used with similar frequency. These differences are not indicative of instructional quality or student learning but show that the two networks differed in how they took advantage of digital resources.
| Resource Category | Percentage of Total Network A Events (n) | Percentage of Total Network D Events (n) | p-value from Hypothesis Test* |
|---|---|---|---|
| Student Edition | 8.8% (140) | 12.6% (984) | .00003** |
| Teacher Guide | 7.1% (112) | 0.2% (17) | .00000** |
| Teacher Guide: Problem solutions | 1.7% (27) | 2.0% (153) | .55309 |
| Planning documents | 0.6% (9) | 0.1% (3) | .00001** |
| Teaching documents | 41.0% (650) | 77.2% (6009) | .00000** |
| Learning logs | 2.3% (37) | 1.1% (88) | .00023** |
| Student work | 20.8% (329) | 1.5% (117) | .00000** |
| Colleagues’ documents | 1.7% (27) | 0.4% (34) | .00000** |
| Collaborative discussions | 2.0% (31) | 0.1% (4) | .00000** |
| Other platform navigation | 14.0% (223) | 4.8% (374) | .00000** |
| Total | 100% (1585) | 100% (7783) |
Although the networks differed in the extent to which they used each resource category, both networks appreciated the affordances of the platform for viewing multiple resources in sequence or side by side. When compared to traditional paper-and-pencil environments, one Network D teacher observed, “It was nice to have [materials] all condensed, so we can switch and use them quickly.” Teachers in Network A were able to view student edition problems, teacher guide resources, and digital student work throughout instructional time. Teachers in Network D focused most heavily on the student edition, viewing multiple parts of the problem during planning and implementation. This flexibility and ease of connection between resources in the CLUE platform made it possible for teachers to use the resources differently according to their needs and way of working.
In order to understand what their students would experience, teachers explored the student edition when planning lessons, prior to making any modifications. In the words of one Network D teacher, this was to ensure “it’s displayed in a way that I find kid-friendly for the kids in my classroom.” Teachers in both networks focused on the initial challenge section of the problem, which engages students in developing multiple strategies and mathematical reasoning. According to one Network A teacher, that initial challenge is “the heart of a lesson or the idea that I think is the most important.” For teachers in both networks, their decisions about which curricular resources to view were shaped by their formative assessments of their students and the key mathematical concepts they wanted to foreground.
| Network A | Network D | |||
|---|---|---|---|---|
| Units | Action Events | Viewing Events | Action Events | Viewing Events |
| Stretching and Shrinking | 142/558(25.45%) | 416/558(74.55%) | 3279/4275(76.70%) | 996/4275(23.30%) |
| Comparing and Scaling | 45/455(9.89%) | 410/455(90.11%) | 323/528(61.17%) | 205/528(38.83%) |
| Moving Straight Ahead | 349/572(61.01%) | 223/572(38.99%) | 2563/2980(86.01%) | 417/2980(13.99%) |
How Teachers Use Digital Materials: Viewing and Action Events
In addition to teachers’ choices about which digital resources to view, they also made instructional decisions about how to interpret and “re-source” those existing materials to support student learning and their own teaching practices. Across all categories, the action events involved interacting with resources, such as creating, copying, or moving tiles; changing graphs, drawings, or tables; publishing documents; creating learning logs or notes to students; and adding or responding to teacher comments. As shown in Table 3, Network D teachers performed a much higher percentage of action events for each unit. While viewing problems, they explored the platform from a student’s perspective by utilizing action tools, which is consistent with their focus on the student edition problems. A large portion of both networks’ events involved editing specific content (e.g., graphs, tables).
Both networks’ digital activity generally aligned with initial surveys on teachers’ resource use when planning without the digital platform (Table 4). Network A indicated daily use of the teacher guide and weekly use of the student edition, and log analytics confirm this general use pattern. Network D indicated daily use of the student edition and weekly use of the teacher guide, and this also aligns with the log analytics. In initial surveys both networks reported using student work only weekly or monthly, but this tended to happen more frequently in the digital platform, particularly for Network A. In contrast, for other resource categories such as colleagues’ documents and planning documents, teacher responses to initial surveys indicated frequent use (often weekly or daily) but digital activity was less frequent. These resources appear less in log files overall, potentially because of their later development timeline.
| Resource Category from Initial Survey | Average survey response for Network A | Average survey response for Network D |
|---|---|---|
| Student Edition | weekly | daily |
| Teacher Guide | daily | weekly |
| Teacher Guide: Problem Solutions | weekly | daily |
| Their planning documents from previous years | weekly | weekly |
| Their student work | weekly or monthly | monthly |
| Colleagues’ planning documents from previous years | monthly | daily |
| Student work from colleagues | rarely | monthly |
| District planning or pacing guide | daily or weekly | N/A |
In both networks, teachers continued to plan and work together outside of the digital platform, although their attempts to use the new digital resources for teacher collaboration and planning showed some differences between networks. Network A, with more members and less common planning time, interacted with collaborative features of the digital platform to a greater extent than Network D, who collaborated daily during shared planning time. The digital resources were used as a complement to each network’s existing ways of planning and working together, rather than a replacement.
Conclusion
Teachers have new opportunities to select and adapt digital resources for their classrooms. Digital platforms offer both increased access to student work and new possibilities for how teachers plan, teach, and reflect on student learning, including as part of networks. Not surprisingly, teachers use digital resources in their classrooms in a variety of ways. We are enhancing features for collaboration, planning, and reflection and studying how teachers and instructional coaches use the rich set of digital tools for student and teacher collaboration.
Research was conducted by Taren Going (goingtar@msu.edu), Alden J. Edson, Ashley Fabry, Sunyoung Park, and Kristen N. Bieda at Michigan State University, and Nathan Kimball and Chad Dorsey at the Concord Consortium.
This material is based upon work supported by the National Science Foundation under grant DRL-2007842. Any opinions, findings, and conclusions or recommendations expressed in this material are those of the author(s) and do not necessarily reflect the views of the National Science Foundation.