Monday’s Lesson: Students Making Models

One of the key practices of the Next Generation Science Standards (NGSS) is “developing and using models,” which should be done in the context of exploring disciplinary core ideas and crosscutting concepts. This definition of modeling is broad, encompassing both using and evaluating simulations made by others as well as defining models through drawings, diagrams, and descriptions. The NGSS practice also includes students building their own simulations based on underlying models of phenomena.
While scientists and engineers commonly build models, existing tools for building and testing models are not typically accessible for students, especially younger students. The Building Models project, a collaboration between the Concord Consortium and the CREATE for STEM Institute at Michigan State University, is designing a new web-based systems modeling tool called SageModeler to address this need. SageModeler is easy to use and accessible to students as young as middle school.
Build a model of ocean acidification
The HS-ESS3-6 performance expectation reads, “Use a computational representation to illustrate the relationships among Earth systems and how those relationships are being modified due to human activity.” With SageModeler, we can model ocean acidification as one example.
-
Open SageModeler
SageModeler is embedded in Concord Consortium’s Common Online Data Analysis Platform (CODAP), which allows you to analyze model outputs with tables and graphs. -
Add variables to the canvas
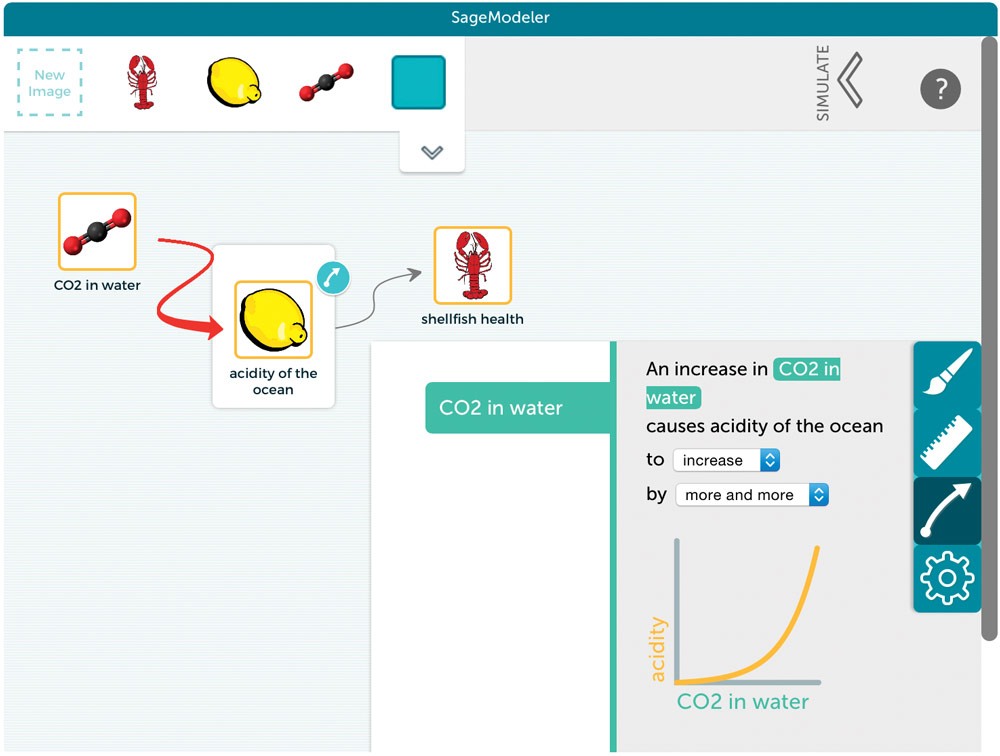
First, brainstorm factors that affect ocean acidification. What contributes to it and what is affected by it? Since ocean acidification is caused by increased levels of carbon dioxide in the water and affects the viability of shellfish and other calcifying organisms, we need at least three variables to model the system: CO₂ in the water, acidity level of the water, and shellfish health. Now, add images for each variable to the canvas. -
Link variables and set relationships
Draw links from one variable to another and select from a menu to set the relationships between those variables. By using words and pictures of graphs (Figure 1), students can define the underlying equations that will be used to run the model without advanced math knowledge. -
Run the model
Open the simulation controls and run the model to collect data. Adjust the model settings to see how changing the variables affects the outcome. Does the model output data make sense? Does it match real-world data? Are the relationships between variables set up appropriately? -
Revise and expand your model
Revise your model to better match the phenomenon you are modeling. The model doesn’t tell the whole story of ocean acidification, so you may want to add more variables. For example, how does carbon dioxide get in the water? What are the sources of CO₂? What other factors moderate the production of CO₂? What else might be affected by changes in the health of shellfish? As you continue to ask new questions, you can revise your model and deepen your understanding of
the system.
We are currently adding functionality to SageModeler, including the ability for older students to define relationships with algebraic definitions. We are also developing curriculum units with multiple opportunities for students to build and revise models of real-world phenomena.
Dan Damelin (ddamelin@concord.org) directs the Building Models project.
This material is based upon work supported by the National Science Foundation under grant DRL-1417809. Any opinions, findings, and conclusions or recommendations expressed in this material are those of the author(s) and do not necessarily reflect the views of the National Science Foundation.
