Under the Hood: Embedding a Simulation in CODAP
In STEM education it’s essential to engage students in undertaking their own projects. But data exploration is often a neglected aspect of student project work. Students must look for patterns in the raw data, identify possible errors and plan further experiments. They also need to add, combine and remove data; transform the data; match datasets to idealized curves and more. The Common Online Data Analysis Platform (CODAP) helps students explore their data. Designed to run in a web browser, CODAP is an easy-to-use, open source data exploration environment.

You can import data into CODAP by dropping a text file into its browser window. Or if you have some JavaScript programming experience you can make a web page simulation that produces data for analysis and investigation in CODAP. Just drop the simulation’s URL into CODAP, where it is embedded as an iFrame. Then use CODAP’s graphs to explore the data.
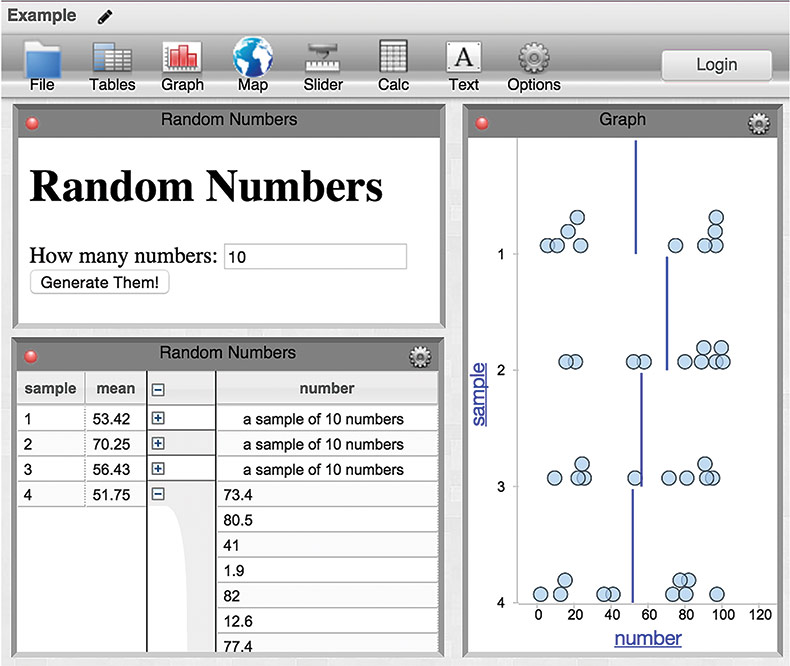
Let’s look at the data from a random number generator (Figure 1).
- Go to: bit.ly/1Mie8tO
- Login as guest.
- Generate some numbers. Now, make a table and graph, and drag column headers to the graph axes. Play around!
- Download the HTML for the page: bit.ly/1A5bhxG
As you’ll see, most of the file is JavaScript contained between script tags.
In order for an iFrame to communicate with CODAP, the two must establish a connection. This happens in the call to codapHelper.initSim where the iFrame tells CODAP its name, dimensions and the structure of the two collections, one for the samples and another for the numbers in each sample. Here’s a portion of that code.
codapHelper.initSim({ name: ‘Random Numbers’, dimensions: {width: 300, height: 200}, collections: [ // There are two collections: a parent and a child ... ] });
The following code generates one random number and tells CODAP to add it to the data. Try changing the range of numbers or round them to the nearest integer.
addOneNumber = function() { if( tHowMany > 0) { var tRandom = Math.random() * 100 + 1; codapHelper.createCase(‘numbers’, tRandom, tID, addOneNumber); tHowMany--; } else codapHelper.closeCase(‘samples’, null, tID); };
You might be surprised that there is no loop for generating the numbers. Instead, the last parameter to codapHelper.createCase is a reference to addOneNumber. This tells the browser that when CODAP is done creating a new case, come back and do it again. This continues until we’ve generated all the numbers and added them to CODAP’s data. Doing things asynchronously like this, the browser redraws continuously so that the points and numbers show up one at a time instead of all at once at the end. It’s especially fun to plot values like the mean, which bounces around while the simulation is running.
To learn more about CODAP, join our mailing list at groups.google.com/group/cc-developers or get the code at GitHub: github.com/concord-consortium/codap. A tutorial based on this article appears at: https://github.com/concord-consortium/codap/wiki/Data-Interactive-Tutorial.
William Finzer (wfinzer@concord.org) directs the CODAP project.
Robert Tinker (rtinker@concord.org) is President Emeritus of the Concord Consortium.
This material is based upon work supported by the National Science Foundation under grants DRL-1435470 and IIS-1147621. Any opinions, findings, and conclusions or recommendations expressed in this material are those of the author(s) and do not necessarily reflect the views of the National Science Foundation.
